September 2, 2019
NPS Timeline report
The report shows the Net Promoters Score in a timeline
The NPS shows how likely a respondent would recommend your company services or products to his friends or colleagues.
The NPS index calculated by formula NPS = Promoters (%) - Detractors (%).
The NPS value is presents as a number in range -100…+100. A positive value is considered as good NPS.
In the timeline the NPS is shown as an icon that represents a certain score range.
Chart view:
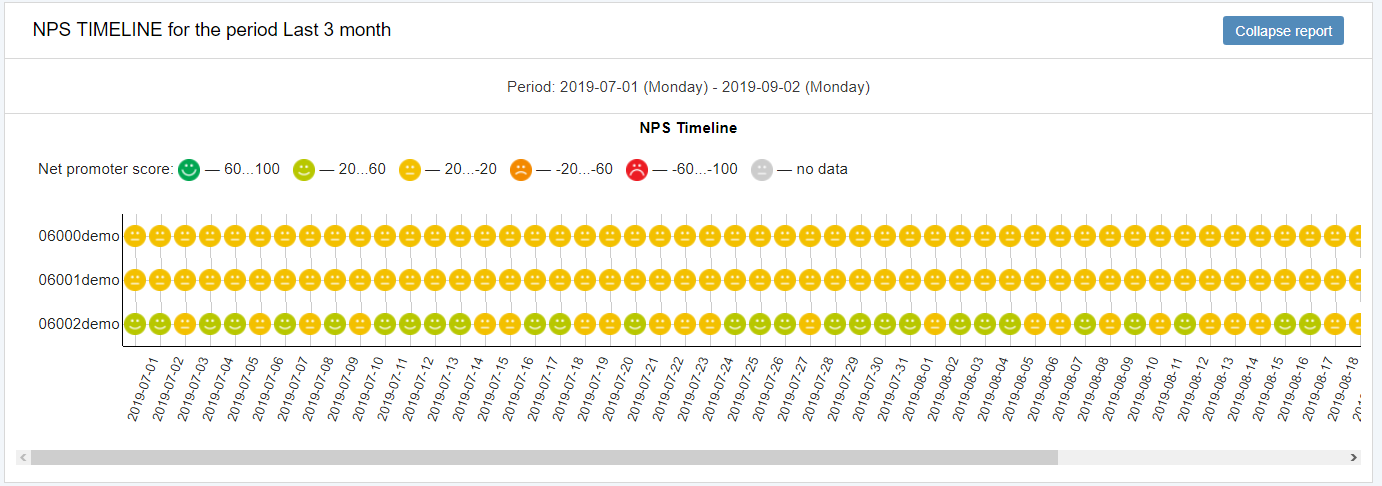
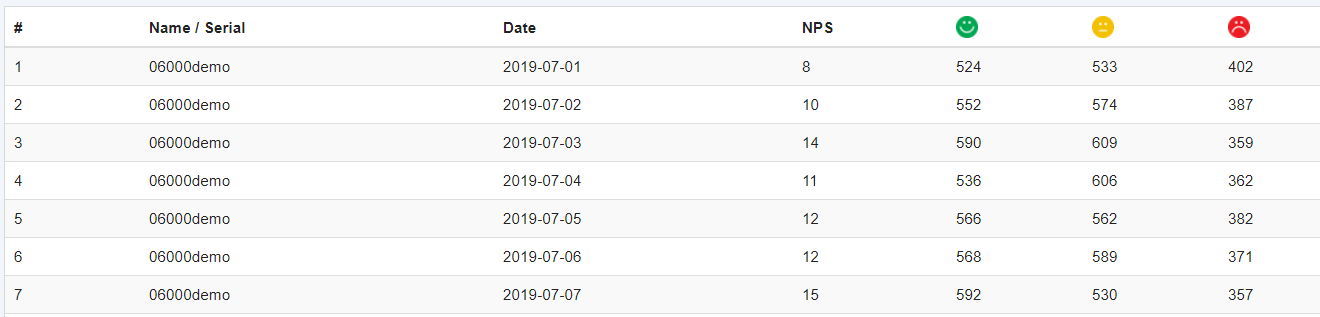
Table view: