Консоль браузера
Motivation
Some tests require the Console to be opened. The web console is part of the developer tools your browser provides. It shows error handling information that was implemented by the developers of a website themselves, or information gathered by your browser if the problem is related to e.g. JavaScript. It will help the customer – specifically the developers – to identify what problem causes the bug.
How to open the console will be explained for different browsers and operating systems step by step in the following article. Note that many of the steps to set up your system only have to be performed once and that every subsequent use will require less steps.
Chrome on computers
- Open the website to be tested.
- Press Ctrl+Shift+J (Windows) or Cmd+Opt+J (Mac).
These shortcuts make sure the Console tab is activated at the top of the developer tools overlay. If you open it with another shortcut or by using Inspect from the right-click menu, you need to manually open the tab Console.
If you want to change the location of the developer tools overlay, click on the “three dots” button at the top right of the overlay. There you can select the Dock side:
Chrome on Android
It is not possible to show the console on your mobile device itself, but it is possible to show it on a connected computer. To do so, the developer options on your Android device need to be enabled. If this is already done, you can skip to Part 3 below.
Part 1: Enable “Developer Options” on your Android device
- For Android 4.1 and below, developer options are enabled by default.
- One-time setup only
Do the following:
- Open the Settings app.
- For Android 8 and higher: select System.
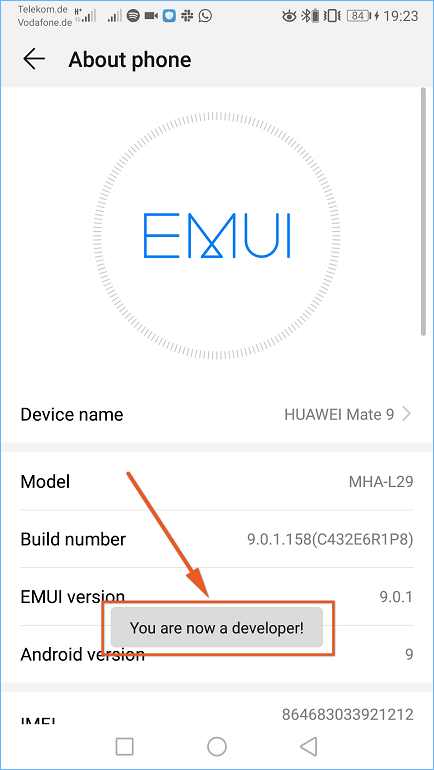
- Select About phone.
- Click on Build number 7 times.

Part 2: Prepare Chrome on your computer
- One-time setup only
Do the following:
- Open Google Chrome.
- Open the Developer tools window (Ctrl+Shift+J on Windows, Cmd+Opt+J on Mac, or via the three dots button at the top right > More tools > Developer tools).
- Click on the three dots button at the top right of your developer tools window.
- Select More tools > Remote devices (see first screenshot below) > The new menu view opens at the bottom of the developer tools window.
- If not already selected, open Settings.
- Make sure Discover USB devices is checked (see second screenshot below).


Part 3: Enable “USB Debugging” in Developer Options on your Android device
After an initial setup, this step unfortunately needs to be performed on most devices again because the USB Debugging setting gets reset after each restart.
Do the following:
- Open Settings app on you Android device.
- For Android 8 and higher: select System.
- Select Developer Options (see screenshot below).
- Switch the toggle at Enable USB Debugging to enable it.

Part 4: Connect Chrome on your computer with your Android device
- Open Google Chrome on your computer.
- Open the Developer tools (Ctrl+Shift+J on Windows or Cmd+Opt+J on Mac).
- Click on the three dots at the top right.
- Select More tools > Remote devices (see first screenshot below) > A new mask opens at the bottom of the developer tools window.
- Connect your Android device to your computer via a USB cable.
- If a red dot is shown and your device is shown as Unknown device, accept the prompt Allow USB Debugging on your Android device. A green dot indicates that everything worked (see second screenshot below).
- If the device is not detected, it helps to disconnect and connect the phone and computer again most times. If it does not help, you can find troubleshooting advice in this Google developer forum post.


Part 5: Start testing
- Open Google Chrome on your Android device and open the website you want to test.
- On your computer, click on the tab with your Android device name/model > Each tab that is opened in Chrome on your Android device will be listed on the view.
- Click on Inspect next to the website you want to test > A new window opens showing your mirrored Android device and the developer tools.
- Make sure the Console tab is open in the developer tools window.
- Start testing (screencasts can be recorded easily on your computer).

Firefox on computers
- Open the website to be tested.
- Press Ctrl+Shift+K or F12 (Windows), or Cmd+Opt+K (Mac).

These shortcuts make sure the Console tab is activated at the top of the developer tools overlay. If you open it with another shortcut or by using Inspect from the right-click menu, you need to manually open the tab Console.
If you want to change the location of the developer tools overlay, click on the “three dots” button at the top right of the overlay. There you can select your preferred view.

Firefox on Android via USB
It is not possible to show the console on your mobile device itself, but it is possible to show it on a connected computer. To do so, some settings on your Android device and computer need to be made once. If you have already made them, you can continue with Part 4.
Note: These instructions only work when you use Firefox 36 and higher on your computer, and Firefox 35 and higher on your Android device.
Part 1: Prepare Firefox on your computer
- One-time setup only
Do the following:
- Open Mozilla Firefox (at least version 36) on your computer.
- Open the Developer Tools (Ctrl+Shift+K or F12 on Windows, or Cmd+Opt+K on Mac).
- Click on the three dots button at the top right of the developer tools overlay and select Settings, or alternatively press F1 on Windows.
- In the Advanced settings, make sure Enable remote debugging is checked.
- Close the developer tools.
- Click on the three bars button at the top right of your Firefox window and select Web Developer > WebIDE, or alternatively press Shift+F8 on Windows > The WebIDE opens.
- In section USB devices at the right edge, click on Install ADB Extension (see first screenshot below).
- Click on Install on the next screen (see second screenshot below).
- Your device will be displayed under USB Devices on the right hand side (see third screenshot below).


Part 2: Enable “Developer Options” on your Android device
- For Android 4.1 and below, developer options are enabled by default.
- One-time setup only
Do the following:
- Open the Settings app.
- For Android 8 and higher: select System.
- Select About phone.
- Click on Build number 7 times.
Part 3: Prepare Firefox on your Android device
- One-time setup only
Do the following:
- Open Mozilla Firefox (at least version 35) on your Android device.
- Open the menu at the top right and select Settings > Advanced.
- Scroll down to the Developer tools section and enable Remote debugging via USB > You might see a hint stating that you need to set up port forwarding, but you can ignore it.

Part 4: Connect Firefox from your computer with your Android device
- One-time setup only
Do the following:
- Open Mozilla Firefox (at least version 36) on your computer.
- Connect your Android device to your computer via a USB cable.
- Open the menu and select Web Developer > WebIDE > The WebIDE opens in a new window.
- At the right sidebar under USB devices, select your Android device > A warning is shown on your Android device.
- Accept this warning on your Android device with OK.
- If you have problems connecting your device, have a look at this Mozilla Developer Forum post.
Part 5: Start testing
- Open Mozilla Firefox on your Android device and open the website you want to test > Each open Firefox tab will be listed under the menu point Tabs at the left sidebar.
- Select the tab of the website you are going to test > The header and URL of the website are shown in the middle of the WebIDE window.
- Make sure the Console tab is open in the developer tools window.
- Start testing.
Firefox on Android via Wi-Fi
It is not possible to show the console on your mobile device itself, but it is possible to show it on a connected computer. To do so, some settings on your Android device and computer need to be made once. If you have already made them, you can continue with Part 2.
These instructions only work when you use Firefox 42 and higher on your computer and your Android device.
Part 1: Prepare Firefox on your Android device
- A bar code scanner is needed – please install one if you don’t have one on your Android device.
- One-time setup only
Do the following:
- Open Mozilla Firefox (at least version 42) on your Android device.
- Open the menu at the top right and select Settings > Advanced.
- Scroll down to the Developer tools section and enable Remote debugging via WiFi.

Part 2: Connect Firefox on your computer with your Android device
- Open Mozilla Firefox (at least version 42) on your computer.
- Open the menu and select Web Developer > WebIDE > The WebIDE opens in a new window.
- At the right sidebar under WiFi devices, select your Android device > A QR code is shown in the WebIDE window and a warning is shown on your Android device.
- Click on Scan or Scan and remember.
- Scan the QR code > The QR code disappears and the icon of the device will turn blue, which stands for connected.
- If you have problems connecting your device, have a look at this Mozilla Developer Forum post.
Part 3: Start testing
- Open Mozilla Firefox on your Android device and open the website you want to test > Each open Firefox tab will be listed under the menu point Tabs at the left sidebar.
- Select the tab of the website you are going to test > The header and URL of the website are shown in the middle of the WebIDE window.
- Make sure the Console tab is open in the developer tools window.
- Start testing.
Edge on computers
- Open the website to be tested.
- Press F12, or alternatively right-click and select Inspect element.
- Switch to the tab Console.

Unfortunately, there is no shortcut to directly open the console in Edge, so please make sure you manually select the right tab.
If you want to change the location of the developer tools overlay, click on the third button from the right (the square with the white part at the right hand side), next to the close button of the overlay. You can switch between docking the overlay to the bottom or the right edge of the screen.
Internet Explorer 11 on computers
- Open the website to be tested.
- Press F12, or alternatively right-click and select Inspect element (see first screenshot below).
- Switch to the tab Console (see second screenshot below).


Unfortunately, there is no shortcut to directly open the console in IE 11, so please make sure you manually select the right tab.