Industrial Pails Market to Reach Approximately USD 9,585 Million by 2027
The global Industrial Pails Market size is anticipated to around USD 9,585 Mn by 2027 and the market is anticipated to grow with 5.2% CAGR during the forecast time period. The report has highlights of global key players present in this market. Top global players are analyzed completely along with their financials, technological innovations, key developments, apart from future strategies, SWOT analysis, acquisitions & mergers, and market footprint. An industrial pail refers to the containers in a cylindrical structure with straight or slanted sides and usually with bail or handle to convenience in handling. These are made up of various types of materials including polyethylene, polypropylene, steel, aluminum, and tin among others. Basically it’s a technical term for buckets used in industrial purposes. The global industrial pails market is segmented into material type, capacity, and end-user. The capacity range starts from 1 gal to 13 gal. By the end-user, the global industrial pails market is bifurcated into agriculture, chemical, pharmaceuticals, food & beverage, petrochemical, building & construction, plastic & rubber, automotive, and mining & metals.
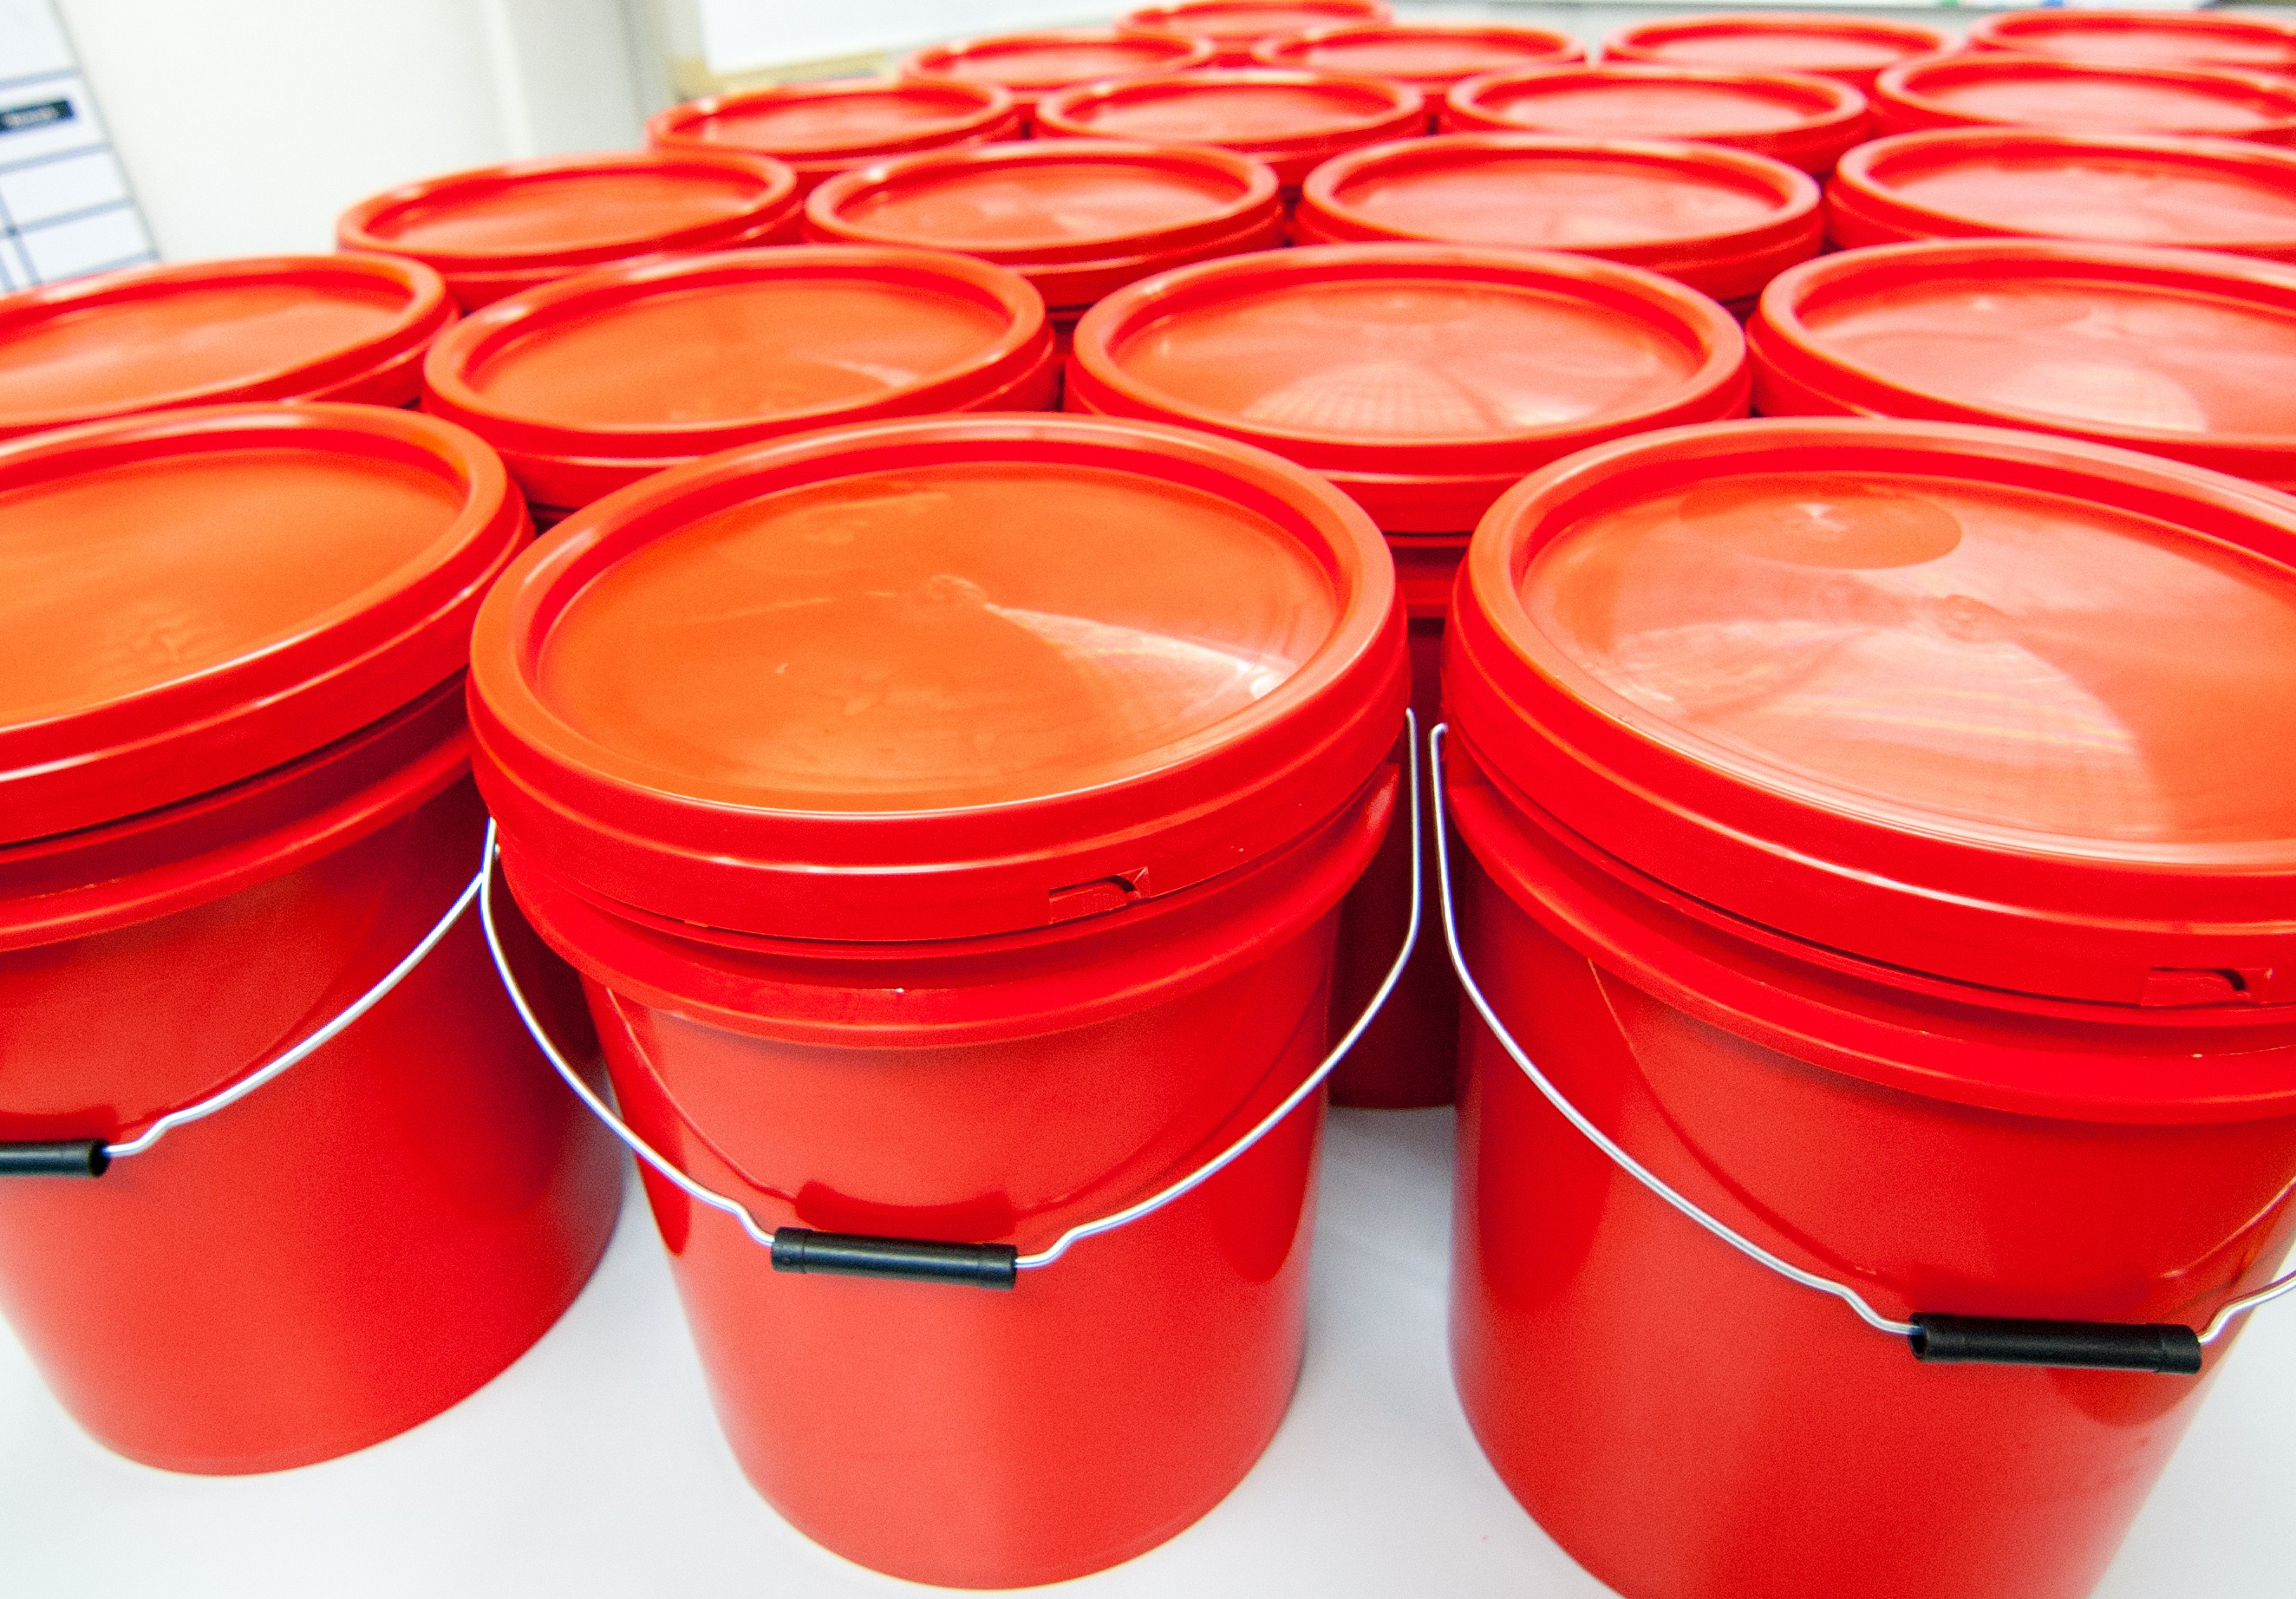
By material type, industrial pail manufactured with high-density polyethylene material is leading the global industrial pail market with major share. The properties associated with high-density polyethylene such as excellent toughness and cut & wear as well as very good chemical resistance are supporting the market value. Furthermore, Stackable high-density polyethylene pails are available in the market with effortless handling and recessed lip. Manufacturers are also providing pails to conform to USDA specifications and FDA compliance. The easy storage and shipping due to the tapered body which allows one pail to nest inside another are also propelling the market growth.
Get Free Report Sample Pages for Better Understanding@ https://www.acumenresearchandconsulting.com/request-sample/1798
In 2019, Asia Pacific held the major share of the global Industrial pails market and expected to lead over the estimated period. The market is also projected to register the fastest growth over the forecast period. Increasing exports from emerging economies like China and India is majorly supporting the market value. Rapidly increasing industrialization and urbanization coupled with rising consumer spending and changing lifestyles are additionally contributing to the regional market value. However, the availability of substitutes such as cans and bottles are projected to hamper the growth to an extent in the regional market during the estimated period.
Related Reports
- Bearings Market – https://finance.yahoo.com/news/bearings-market-size-reach-us-210010229.html
- Material Handling Equipment Market – https://finance.yahoo.com/news/material-handling-equipment-market-size-020010950.html
- Building Thermal Insulation Market – https://finance.yahoo.com/news/building-thermal-insulation-market-garner-210000196.html
Some of the leading competitors are Balmer Lawrie & Co. Ltd, Delta Containers Direct Limited, FDL Packaging Group, Fibrestar Drums Ltd, Grief Inc., Industrial Container Services, Mauser Group B.V., Orora Packaging Australia Pty Ltd, SCHÜTZ GmbH & Co., and Sonoco. The major industrial pails companies have announced mergers and acquisitions to expand their position in the industrial pails industry. Major players are also moving into new regions or advanced technologies for gaining competitive advantage.
Some of the key observations regarding industrial pails industry include:
- TriMas Corp. has signed an agreement to buy Plastic Srl, an Italian molder of plastic caps and closures. The deal was scheduled to close in 2019. After the acquisition Plastic Srl was intended to become a wholly-owned division of TriMas’ Rieke Packaging Systems business. Whereas, Rieke makes specialty dispensing systems including plastic and steel closures, caps, and pail enclosures among others.
- In 2019, Reliance Products LTD and Bucket Innovations, LLC have announced a new North American distribution partnership agreement, which allows Reliance Products the licensing rights to manufacture and market Bucket Innovations’ industrial-grade high-density polyethylene (HDPE) pails with a patented, integrated handle throughout North America. The new Reliance 5-Gallon Pail was scheduled to be available from the beginning of July 2019 through both Reliance’s industrial and outdoor recreation decisions. Furthermore, Bucket Innovations, LLC has developed a patented bucket design by integrating a molded handle into the bottom of industrial-grade pails. The new 5 gallon pail improves efficiency and ergonomics for the user and also adds a beneficial safety layer over traditional five-gallon pails.
- BMB SpA, an Italian injection molding machinery maker is exhibiting its eKW55Pi/7000 hybrid injection molding machine at NPE2018. The machine is producing a 5-gallon industrial pail made from high-density polyethylene in a cycle time of 14 seconds. The 550-tonne hybrid press is designed to run much faster than conventional molds that are built for plastic industrial pails, which leads to a 25% improvement of output in parts per hour.
Market Segmentation
Market By Material Type
- High Density Polyethylene
- Low Density Polyethylene
- Polypropylene
- Steel
- Aluminium
- Tin
- Other Materials
Market By Capacity
- 1 Gal
- 3 Gal
- 4 Gal
- 6 Gal
- 9 Gal
- 10 Gal
- 12 Gal
Market By End User
- Agriculture
- Chemical
- Pharmaceuticals
- Food & Beverage
- Petrochemical
- Building & Construction
- Plastic & Rubber
- Automotive
- Mining & Metals
Market By Geography
North America
- U.S.
- Canada
Europe
- UK
- Germany
- France
- Spain
- Rest of Europe
Asia-Pacific
- China
- Japan
- India
- Australia
- South Korea
- Rest of Asia-Pacific
Latin America
- Brazil
- Mexico
- Rest of Latin America
Middle East & Africa
- GCC
- South Africa
- Rest of Middle East & Africa
TABLE OF CONTENT
CHAPTER 1. INDUSTRY OVERVIEW
1.1. Definition and Scope
1.1.1. Definition of Industrial Pails
1.1.2. Market Segmentation
1.1.3. List of Abbreviations
1.2. Summary
1.2.1. Market Snapshot
1.2.2. Industrial Pails Market By Material Type
1.2.2.1. Global Industrial Pails Market Revenue and Growth Rate Comparison By Material Type (2015-2026)
1.2.2.2. Global Industrial Pails Market Revenue Share By Material Type in 2018
1.2.2.3. High Density Polyethylene
1.2.2.4. Low Density Polyethylene
1.2.2.5. Polypropylene
1.2.2.6. Steel
1.2.2.7. Aluminium
1.2.2.8. Tin
1.2.2.9. Other Materials
1.2.3. Industrial Pails Market By Capacity
1.2.3.1. Global Industrial Pails Market Revenue and Growth Rate Comparison By Capacity (2015-2026)
1.2.3.2. 1 Gal
1.2.3.3. 3 Gal
1.2.3.4. 4 Gal
1.2.3.5. 6 Gal
1.2.3.6. 9 Gal
1.2.3.7. 10 Gal
1.2.3.8. 12 Gal
1.2.4. Industrial Pails Market By End User
1.2.4.1. Global Industrial Pails Market Revenue and Growth Rate Comparison By End User (2015-2026)
1.2.4.2. Agriculture
1.2.4.3. Chemical
1.2.4.4. Pharmaceuticals
1.2.4.5. Food & Beverage
1.2.4.6. Petrochemical
1.2.4.7. Building & Construction
1.2.4.8. Plastic & Rubber
1.2.4.9. Automotive
1.2.4.10. Mining & Metals
1.2.5. Industrial Pails Market By Geography
1.2.5.1. Global Industrial Pails Market Revenue and Growth Rate Comparison By Geography (2015-2026)
1.2.5.2. North America Industrial Pails Market Revenue and Growth Rate(2015-2026)
1.2.5.3. Europe Industrial Pails Market Revenue and Growth Rate(2015-2026)
1.2.5.4. Asia-Pacific Industrial Pails Market Revenue and Growth Rate(2015-2026)
1.2.5.5. Latin America Industrial Pails Market Revenue and Growth Rate(2015-2026)
1.2.5.6. Middle East and Africa (MEA) Industrial Pails Market Revenue and Growth Rate(2015-2026)
CHAPTER 2. MARKET DYNAMICS AND COMPETITION ANALYSIS
2.1. Market Drivers
2.2. Restraints and Challenges
2.3. Growth Opportunities
2.4. Porter’s Five Forces Analysis
2.4.1. Bargaining Power of Suppliers
2.4.2. Bargaining Power of Buyers
2.4.3. Threat of Substitute
2.4.4. Threat of New Entrants
2.4.5. Degree of Competition
2.5. Value Chain Analysis
2.6. Cost Structure Analysis
2.6.1. Raw Material and Suppliers
2.6.2. Manufacturing Process Analysis
2.7. Regulatory Compliance
2.8. Competitive Landscape, 2018
2.8.1. Player Positioning Analysis
2.8.2. Key Strategies Adopted By Leading Players
CHAPTER 3. MANUFACTURING PLANTS ANALYSIS
3.1. Capacity and Commercial Production Date of Global Industrial Pails Major Manufacturers in 2018
3.2. Manufacturing Plants Distribution of Global Industrial Pails Major Manufacturers in 2018
3.3. R&D Status and Technology Source of Global Industrial Pails Major Manufacturers in 2018
3.4. Raw Materials Sources Analysis of Global Industrial Pails Major Manufacturers in 2018
CHAPTER 4. INDUSTRIAL PAILS MARKET BY MATERIAL TYPE
4.1. Global Industrial Pails Revenue By Material Type
4.2. High Density Polyethylene
4.2.1. Market Revenue and Growth Rate, 2015 – 2026 ($Million)
4.2.2. Market Revenue and Forecast, By Region, 2015 – 2026 ($Million)
4.3. Low Density Polyethylene
4.3.1. Market Revenue and Growth Rate, 2015 – 2026 ($Million)
4.3.2. Market Revenue and Forecast, By Region, 2015 – 2026 ($Million)
4.4. Steel
4.4.1. Market Revenue and Growth Rate, 2015 – 2026 ($Million)
4.4.2. Market Revenue and Forecast, By Region, 2015 – 2026 ($Million)
4.5. Aluminium
4.5.1. Market Revenue and Growth Rate, 2015 – 2026 ($Million)
4.5.2. Market Revenue and Forecast, By Region, 2015 – 2026 ($Million)
4.6. Tin
4.6.1. Market Revenue and Growth Rate, 2015 – 2026 ($Million)
4.6.2. Market Revenue and Forecast, By Region, 2015 – 2026 ($Million)
4.7. Other Materials
4.7.1. Market Revenue and Growth Rate, 2015 – 2026 ($Million)
4.7.2. Market Revenue and Forecast, By Region, 2015 – 2026 ($Million)
CHAPTER 5. INDUSTRIAL PAILS MARKET BY CAPACITY
5.1. Global Industrial Pails Revenue By Capacity
5.2. 1 Gal
5.2.1. Market Revenue and Growth Rate, 2015 – 2026 ($Million)
5.2.2. Market Revenue and Forecast, By Region, 2015 – 2026 ($Million)
5.3. 3 Gal
5.3.1. Market Revenue and Growth Rate, 2015 – 2026 ($Million)
5.3.2. Market Revenue and Forecast, By Region, 2015 – 2026 ($Million)
5.4. 4 Gal
5.4.1. Market Revenue and Growth Rate, 2015 – 2026 ($Million)
5.4.2. Market Revenue and Forecast, By Region, 2015 – 2026 ($Million)
5.5. 6 Gal
5.5.1. Market Revenue and Growth Rate, 2015 – 2026 ($Million)
5.5.2. Market Revenue and Forecast, By Region, 2015 – 2026 ($Million)
5.6. 9 Gal
5.6.1. Market Revenue and Growth Rate, 2015 – 2026 ($Million)
5.6.2. Market Revenue and Forecast, By Region, 2015 – 2026 ($Million)
5.7. 10 Gal
5.7.1. Market Revenue and Growth Rate, 2015 – 2026 ($Million)
5.7.2. Market Revenue and Forecast, By Region, 2015 – 2026 ($Million)
5.8. 12 Gal
5.8.1. Market Revenue and Growth Rate, 2015 – 2026 ($Million)
5.8.2. Market Revenue and Forecast, By Region, 2015 – 2026 ($Million)
CHAPTER 6. INDUSTRIAL PAILS MARKET BY END USER
6.1. Global Industrial Pails Revenue By End User
6.2. Agriculture
6.2.1. Market Revenue and Growth Rate, 2015 – 2026 ($Million)
6.2.2. Market Revenue and Forecast, By Region, 2015 – 2026 ($Million)
6.3. Chemical
6.3.1. Market Revenue and Growth Rate, 2015 – 2026 ($Million)
6.3.2. Market Revenue and Forecast, By Region, 2015 – 2026 ($Million)
6.4. Pharmaceuticals
6.4.1. Market Revenue and Growth Rate, 2015 – 2026 ($Million)
6.4.2. Market Revenue and Forecast, By Region, 2015 – 2026 ($Million)
6.5. Food & Beverage
6.5.1. Market Revenue and Growth Rate, 2015 – 2026 ($Million)
6.5.2. Market Revenue and Forecast, By Region, 2015 – 2026 ($Million)
6.6. Petrochemical
6.6.1. Market Revenue and Growth Rate, 2015 – 2026 ($Million)
6.6.2. Market Revenue and Forecast, By Region, 2015 – 2026 ($Million)
6.7. Building & Construction
6.7.1. Market Revenue and Growth Rate, 2015 – 2026 ($Million)
6.7.2. Market Revenue and Forecast, By Region, 2015 – 2026 ($Million)
6.8. Plastic & Rubber
6.8.1. Market Revenue and Growth Rate, 2015 – 2026 ($Million)
6.8.2. Market Revenue and Forecast, By Region, 2015 – 2026 ($Million)
6.9. Automotive
6.9.1. Market Revenue and Growth Rate, 2015 – 2026 ($Million)
6.9.2. Market Revenue and Forecast, By Region, 2015 – 2026 ($Million)
6.10. Mining & Metals
6.10.1. Market Revenue and Growth Rate, 2015 – 2026 ($Million)
6.10.2. Market Revenue and Forecast, By Region, 2015 – 2026 ($Million)
CHAPTER 7. NORTH AMERICA INDUSTRIAL PAILS MARKET BY COUNTRY
7.1. North America Industrial Pails Market Revenue and Growth Rate, 2015 – 2026 ($Million)
7.2. North America Industrial Pails Market Revenue Share Comparison, 2015 & 2026 (%)
7.3. U.S.
7.3.1. U.S. Industrial Pails Market Revenue and Forecast By Material Type, 2015 – 2026 ($Million)
7.3.2. Market Revenue and Forecast By Capacity, 2015 – 2026 ($Million)
7.3.3. Market Revenue and Forecast By End User, 2015 – 2026 ($Million)
7.4. Canada
7.4.1. Market Revenue and Forecast By Material Type, 2015 – 2026 ($Million)
7.4.2. Market Revenue and Forecast By Capacity, 2015 – 2026 ($Million)
7.4.3. Market Revenue and Forecast By End User, 2015 – 2026 ($Million)
CHAPTER 8. EUROPE INDUSTRIAL PAILS MARKET BY COUNTRY
8.1. Europe Industrial Pails Market Revenue and Growth Rate, 2015 – 2026 ($Million)
8.2. Europe Industrial Pails Market Revenue Share Comparison, 2015 & 2026 (%)
8.3. UK
8.3.1. Market Revenue and Forecast By Material Type, 2015 – 2026 ($Million)
8.3.2. Market Revenue and Forecast By Capacity, 2015 – 2026 ($Million)
8.3.3. Market Revenue and Forecast By End User, 2015 – 2026 ($Million)
8.4. Germany
8.4.1. Market Revenue and Forecast By Material Type, 2015 – 2026 ($Million)
8.4.2. Market Revenue and Forecast By Capacity, 2015 – 2026 ($Million)
8.4.3. Market Revenue and Forecast By End User, 2015 – 2026 ($Million)
8.5. France
8.5.1. Market Revenue and Forecast By Material Type, 2015 – 2026 ($Million)
8.5.2. Market Revenue and Forecast By Capacity, 2015 – 2026 ($Million)
8.5.3. Market Revenue and Forecast By End User, 2015 – 2026 ($Million)
8.6. Spain
8.6.1. Market Revenue and Forecast By Material Type, 2015 – 2026 ($Million)
8.6.2. Market Revenue and Forecast By Capacity, 2015 – 2026 ($Million)
8.6.3. Market Revenue and Forecast By End User, 2015 – 2026 ($Million)
8.7. Rest of Europe
8.7.1. Market Revenue and Forecast By Material Type, 2015 – 2026 ($Million)
8.7.2. Market Revenue and Forecast By Capacity, 2015 – 2026 ($Million)
8.7.3. Market Revenue and Forecast By End User, 2015 – 2026 ($Million)
CHAPTER 9. ASIA-PACIFIC INDUSTRIAL PAILS MARKET BY COUNTRY
9.1. Asia-Pacific Industrial Pails Market Revenue and Growth Rate, 2015 – 2026 ($Million)
9.2. Asia-Pacific Industrial Pails Market Revenue Share Comparison, 2015 & 2026 (%)
9.3. China
9.3.1. Market Revenue and Forecast By Material Type, 2015 – 2026 ($Million)
9.3.2. Market Revenue and Forecast By Capacity, 2015 – 2026 ($Million)
9.3.3. Market Revenue and Forecast By End User, 2015 – 2026 ($Million)
9.4. Japan
9.4.1. Market Revenue and Forecast By Material Type, 2015 – 2026 ($Million)
9.4.2. Market Revenue and Forecast By Capacity, 2015 – 2026 ($Million)
9.4.3. Market Revenue and Forecast By End User, 2015 – 2026 ($Million)
9.5. India
9.5.1. Market Revenue and Forecast By Material Type, 2015 – 2026 ($Million)
9.5.2. Market Revenue and Forecast By Capacity, 2015 – 2026 ($Million)
9.5.3. Market Revenue and Forecast By End User, 2015 – 2026 ($Million)
9.6. Australia
9.6.1. Market Revenue and Forecast By Material Type, 2015 – 2026 ($Million)
9.6.2. Market Revenue and Forecast By Capacity, 2015 – 2026 ($Million)
9.6.3. Market Revenue and Forecast By End User, 2015 – 2026 ($Million)
9.7. South Korea
9.7.1. Market Revenue and Forecast By Material Type, 2015 – 2026 ($Million)
9.7.2. Market Revenue and Forecast By Capacity, 2015 – 2026 ($Million)
9.7.3. Market Revenue and Forecast By End User, 2015 – 2026 ($Million)
9.8. Rest of Asia-Pacific
9.8.1. Market Revenue and Forecast By Material Type, 2015 – 2026 ($Million)
9.8.2. Market Revenue and Forecast By Capacity, 2015 – 2026 ($Million)
9.8.3. Market Revenue and Forecast By End User, 2015 – 2026 ($Million)
CHAPTER 10. LATIN AMERICA INDUSTRIAL PAILS MARKET BY COUNTRY
10.1. Latin America Industrial Pails Market Revenue and Growth Rate, 2015 – 2026 ($Million)
10.2. Latin America Industrial Pails Market Revenue Share Comparison, 2015 & 2026 (%)
10.3. Brazil
10.3.1. Market Revenue and Forecast By Material Type, 2015 – 2026 ($Million)
10.3.2. Market Revenue and Forecast By Capacity, 2015 – 2026 ($Million)
10.3.3. Market Revenue and Forecast By End User, 2015 – 2026 ($Million)
10.4. Mexico
10.4.1. Market Revenue and Forecast By Material Type, 2015 – 2026 ($Million)
10.4.2. Market Revenue and Forecast By Capacity, 2015 – 2026 ($Million)
10.4.3. Market Revenue and Forecast By End User, 2015 – 2026 ($Million)
10.5. Rest of Latin America
10.5.1. Market Revenue and Forecast By Material Type, 2015 – 2026 ($Million)
10.5.2. Market Revenue and Forecast By Capacity, 2015 – 2026 ($Million)
10.5.3. Market Revenue and Forecast By End User, 2015 – 2026 ($Million)
CHAPTER 11. MIDDLE EAST & AFRICA INDUSTRIAL PAILS MARKET BY COUNTRY
11.1. Middle East & Africa Industrial Pails Market Revenue and Growth Rate, 2015 – 2026 ($Million)
11.2. Middle East & Africa Industrial Pails Market Revenue Share Comparison, 2015 & 2026 (%)
11.3. GCC
11.3.1. Market Revenue and Forecast By Material Type, 2015 – 2026 ($Million)
11.3.2. Market Revenue and Forecast By Capacity, 2015 – 2026 ($Million)
11.3.3. Market Revenue and Forecast By End User, 2015 – 2026 ($Million)
11.4. South Africa
11.4.1. Market Revenue and Forecast By Material Type, 2015 – 2026 ($Million)
11.4.2. Market Revenue and Forecast By Capacity, 2015 – 2026 ($Million)
11.4.3. Market Revenue and Forecast By End User, 2015 – 2026 ($Million)
11.5. Rest of Middle East & Africa
11.5.1. Market Revenue and Forecast By Material Type, 2015 – 2026 ($Million)
11.5.2. Market Revenue and Forecast By Capacity, 2015 – 2026 ($Million)
11.5.3. Market Revenue and Forecast By End User, 2015 – 2026 ($Million)
CHAPTER 12. COMPANY PROFILE
12.1. Balmer Lawrie & Co. Ltd
12.1.1. Company Snapshot
12.1.2. Overview
12.1.3. Financial Overview
12.1.4. Type Portfolio
12.1.5. Key Developments
12.1.6. Strategies
12.2. Delta Containers Direct Limited
12.2.1. Company Snapshot
12.2.2. Overview
12.2.3. Financial Overview
12.2.4. Type Portfolio
12.2.5. Key Developments
12.2.6. Strategies
12.3. FDL Packaging Group
12.3.1. Company Snapshot
12.3.2. Overview
12.3.3. Financial Overview
12.3.4. Type Portfolio
12.3.5. Key Developments
12.3.6. Strategies
12.4. Fibrestar Drums Ltd
12.4.1. Company Snapshot
12.4.2. Overview
12.4.3. Financial Overview
12.4.4. Type Portfolio
12.4.5. Key Developments
12.4.6. Strategies
12.5. Grief Inc.
12.5.1. Company Snapshot
12.5.2. Overview
12.5.3. Financial Overview
12.5.4. Type Portfolio
12.5.5. Key Developments
12.5.6. Strategies
12.6. Industrial Container Services
12.6.1. Company Snapshot
12.6.2. Overview
12.6.3. Financial Overview
12.6.4. Type Portfolio
12.6.5. Key Developments
12.6.6. Strategies
12.7. Mauser Group B.V.
12.7.1. Company Snapshot
12.7.2. Overview
12.7.3. Financial Overview
12.7.4. Type Portfolio
12.7.5. Key Developments
12.7.6. Strategies
12.8. Orora Packaging Australia Pty Ltd
12.8.1. Company Snapshot
12.8.2. Overview
12.8.3. Financial Overview
12.8.4. Type Portfolio
12.8.5. Key Developments
12.8.6. Strategies
12.9. Remondis SE & Co. Kg
12.9.1. Company Snapshot
12.9.2. Overview
12.9.3. Financial Overview
12.9.4. Type Portfolio
12.9.5. Key Developments
12.9.6. Strategies
12.10. SCHÜTZ GmbH & Co.
12.10.1. Company Snapshot
12.10.2. Overview
12.10.3. Financial Overview
12.10.4. Type Portfolio
12.10.5. Key Developments
12.10.6. Strategies
12.11. Others
12.11.1. Company Snapshot
12.11.2. Overview
12.11.3. Financial Overview
12.11.4. Type Portfolio
12.11.5. Key Developments
12.11.6. Strategies
CHAPTER 13. RESEARCH APPROACH
13.1. Research Methodology
13.1.1. Initial Data Search
13.1.2. Secondary Research
13.1.3. Primary Research
13.2. Assumptions and Scope
The report is readily available and can be dispatched immediately after payment confirmation.
Buy this premium research report@ https://www.acumenresearchandconsulting.com/buy-now/0/1798
About Acumen Research and Consulting:
Acumen Research and Consulting (ARC) is a global provider of market intelligence and consulting services to information technology, investment, telecommunication, manufacturing, and consumer technology markets. ARC helps investment communities, IT professionals, and business executives to make fact-based decisions on technology purchases and develop firm growth strategies to sustain market competition. With the team size of 100+ Analysts and collective industry experience of more than 200 years, Acumen Research and Consulting assures to deliver a combination of industry knowledge along with global and country level expertise.
Contact Us:
Saurabh S. Phone: +14079154157 | +14089009135 Email: saurabh@acumenresearchandconsulting.com Website: https://www.acumenresearchandconsulting.com Follow Us: LinkedIN| Twitter