VFC isn't a good choice in short term period
Последнее время вы видим иррациональное движение индекса СнП 500 вверх, преймущественно за счет пресловутого фаанга. Большинство компаний из реального сектора показало падение выручки, иногда очень даже значительное.
V.F. Corp. (NYSE:VFC) is an apparel manufacturer with several brands. which include popular names like The North Face, Vans and etc. With revenues of ... in fiscal 2020, the company keeps a leading position in the market with giants like Columbia Sportswear (NASDAQ:COLM), Ralph Lauren (NYSE:RL) Hanesbrands (), and newbie Crocs () (they have sales figures of ..., respectively)
https://finviz.com/chart.ashx?t=VFC&ty=c&ta=0&p=d&s=l
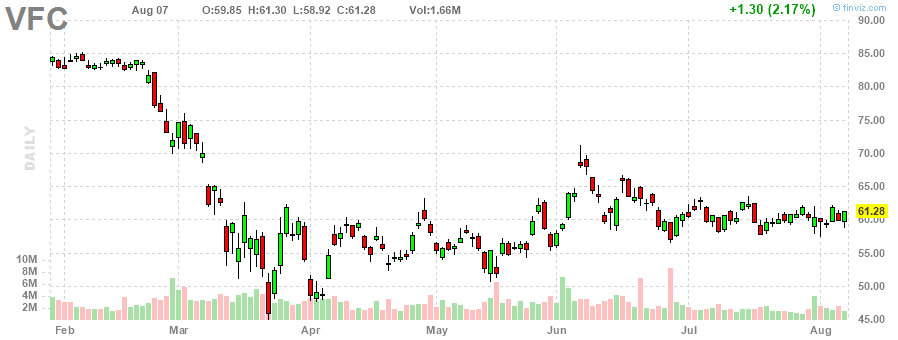
Source:
Last time, Apparel, Accessories and Luxury Goods industry industry is going through a difficult time. Certain companies, like ... fell into bankruptcy.
Как рассказвает WSJ вакцина появится не ранее 2021 года, а вторая волна короновируса (как показала история и испанкой) бывает еще хуже, чем первая.
The market was underwhelmed by VFC's fiscal Q3 2020 earnings results. The highlights of the report are as follows:
- VFC's revenue In the report for the second quarter of fiscal year 2021.
Q1 Earnings
Highlights:
- Revenue dropped by 47% in the quarter (to $3.4 billion on an FX-neutral basis, and FY 2020 revenue is expected to increase by 7% on an FX-neutral basis to $11.75 billion.) но все же побила ожидания.
- Сильнее всего пострадали сегменты Outdoor () and Active (), -44% and -54%. Меньше всего Work segment -19%.
- Overall international revenues decincreased by 39%; sales in Europe, the Middle East and Africa decincreased by 4%; sales in Greater China remain unchanged; and U.S. sales decincreased by 54%.
- Wholesale and Direct-to-consumer channels revenue dropped by 55% and 37% correspondingly. But Digital increase by 78%. Management looks forward to continuing this growth throughout fiscal year 2021.
Five reason why i will avoid VFC in nearest future
Despite the fact, that the ROE ratio has been increase during the last two decades the main driver of this growth is the expansion of the financial leverage.
В апреле 2020 года компания увеличла свои общие обязательства на 3000 мил, все - за счет долгосрочного кредита. Ниже можно увидеть заметку к этому
Хотя пока коеффициенты покрытия говорят, что у компании все гуд, мне не нравится, что компания так сильно увеличила свою подушку безопасности. Ведь далеко не факт, что выручка за следующий год восстановится до прежних значений, а проценты будут сьедать кеш на балансе вместе с возможными операционными убытками. Плюс добавить к этому финансовую активность, диведенды и байбеки, payuoy ratio div увелечилось очень сильно за последние несколько лет.
Посчитав достаточно стандартный коефициент покрытия обязательств активами получаем не очень красивую цифрц 0.93, а это еще и балансовая стоимости активов.
P/E очень сильно увеличилось по сравнению в другими компаниями из того же сегмента за период пандемии. (из за чего скорее всего?)
https://seekingalpha.com/symbol/VFC/charting?metric=peGaap
Как вы можете видеть на диаграмме , working capital manadgment оставляет желать лучшего (и до пандемии все было не так уж хорошо).
На протяжении последних ... the cash conversion cycle увелечился с ... до ...
Основная причина тому - плохой тренд на увелечение in the days of inventory on hand.
другой фактор влияющий на ситуацию - is the days of payables (essentially, this is credit provided by suppliers) они упали с такого то значения до такого то (a form of credit squeeze)
At the moment, they account for less than 15% of the days of inventory on hand. This means the company has to borrow money to finance its daily operations, which negatiively affects margins and financial stability.
The effective tax rate that fall lower over the last three years may go up as things move towards normalcy.
We believe share buybacks may also come under pressure because of the shrinking net cash position on the books at a time when the indusrty growth is restrained and the business will have to spend more to drive growth.
The Diagram shows the history of operating cash flows. You can clearly see that it has sharply fallen in fiscal 2015.
Future cash flow generation is questionable because of issues highlighted above. Moreover, if the company spends more than 100% of its free cash flows on div and buybacks instead of expanding its business, what can we really say about its future growth?
Risks (from annual report of 2020 fiscal year)
Conclusion