The Worst Quarter of the Crypto Market: June 2022 in numbers
Hello, dHEDGE community! This is a monthly article of the latest events analytics. This quarter was one of the worst in the history of the crypto market. Bitcoin has dropped to below $20,000. I hope you have survived these worst times. Let's analyze some figures to better understand what has been happening to the market over the past month.
Summary
- Leading cryptocurrencies closed the worst quarter since 2011. Bitcoin has failed the $20,000 level.
- The volume of trading on centralized exchanges decreased to the values of December 2020.
- Some on-chain indicators give signals to buy bitcoin.
- The incomes of Bitcoin and Ethereum miners decreased by 26% and 52%, respectively.
- Issuers of stablecoins have reduced the issue. The exception was the USDC from Circle.
- The NFT segment shows signs of a burst bubble.
- The "fear and greed index" dropped to the levels of August 2019.
- The total value of assets in the DeFi segment fell by 36%.
- The Avalanche ecosystem came in third place on TVL.
BTC & ETH Dynamics
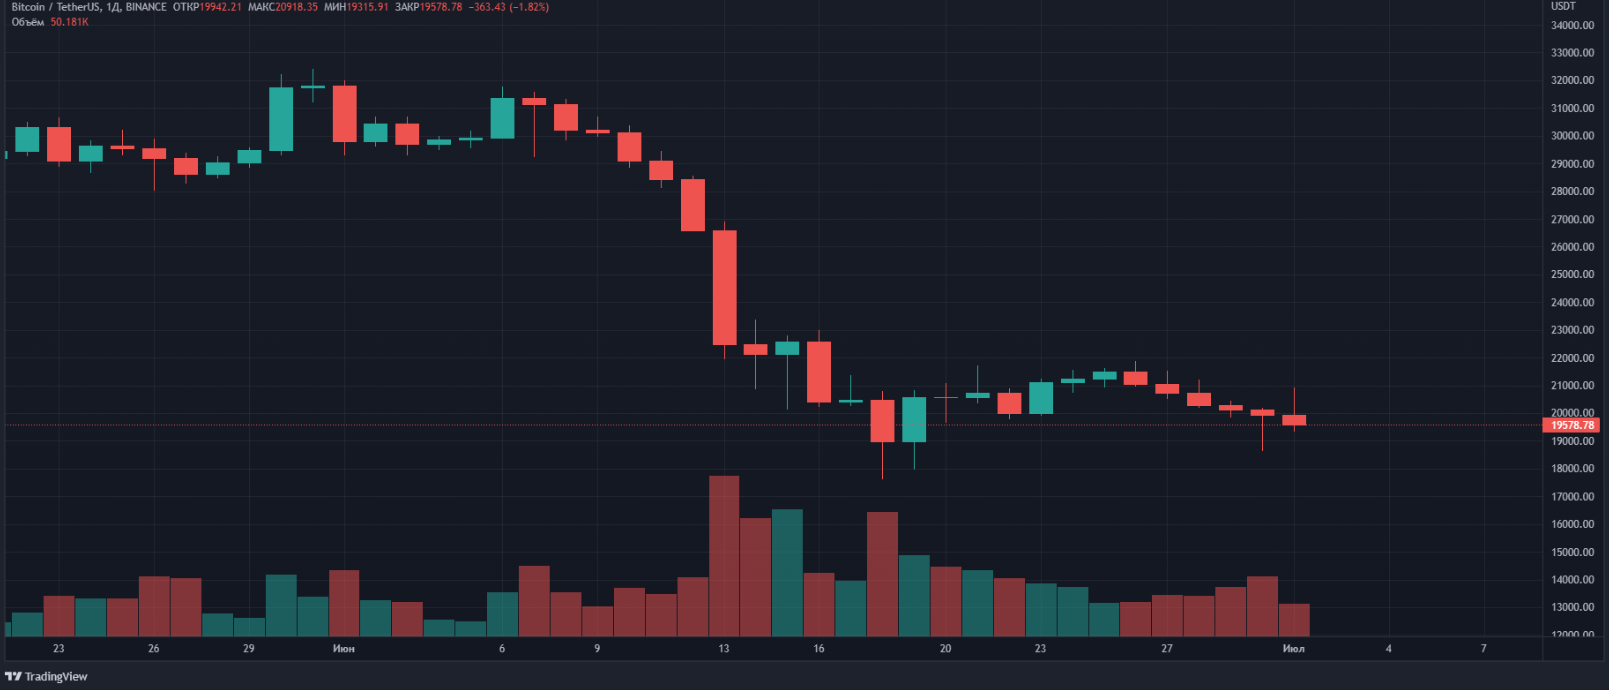
- June 2022 and the second quarter as a whole were remembered for the most extensive correction since 2011. Starting the month near $32,000, the bitcoin exchange rate has updated the minimum since the end of 2020 at $17,622 (June 18 on the Binance exchange) and closed the month below $20,000.
- Traditionally, the flagship pulled down the entire crypto market — at the moment the total capitalization fell below $ 800 billion.
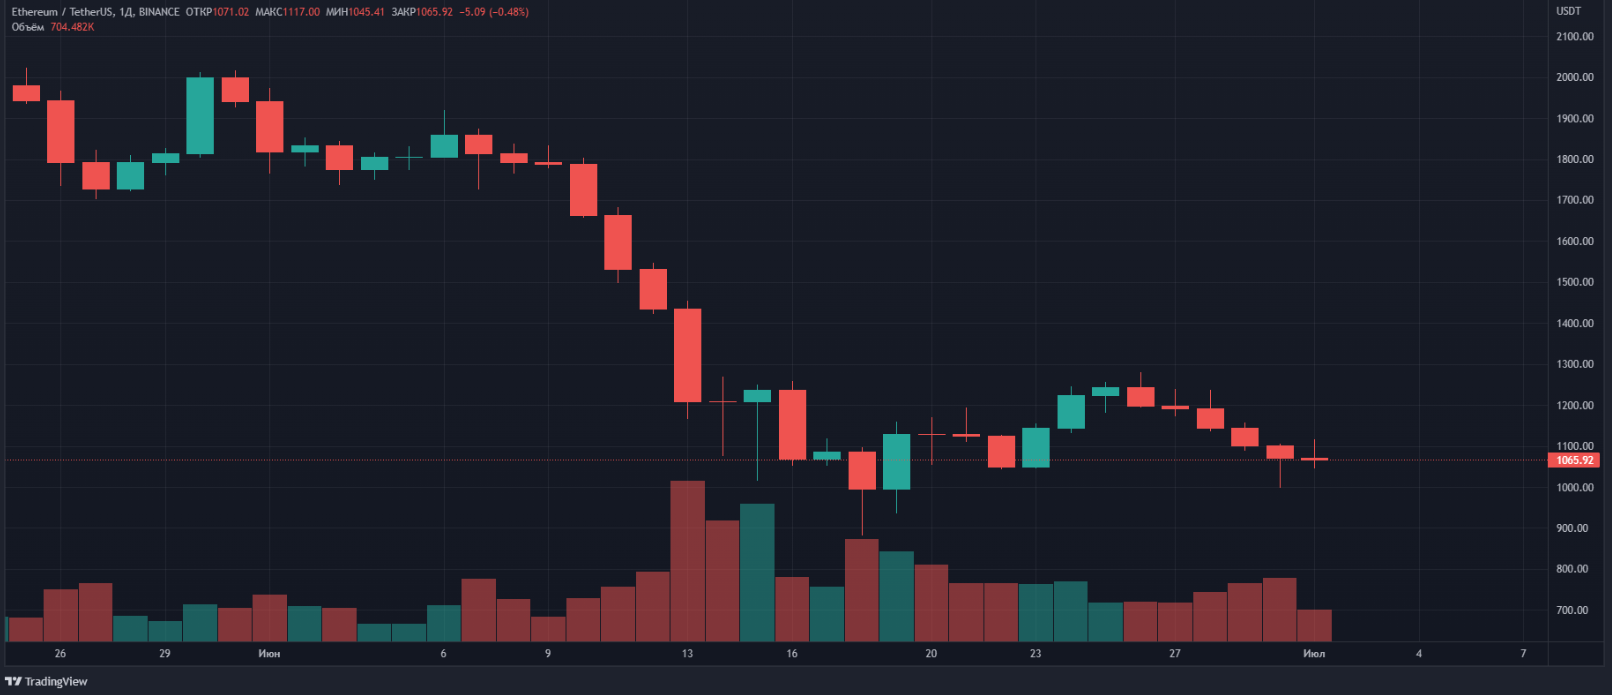
- Ethereum has failed the key psychological support level of $1000. On June 18, the rate reached $881.
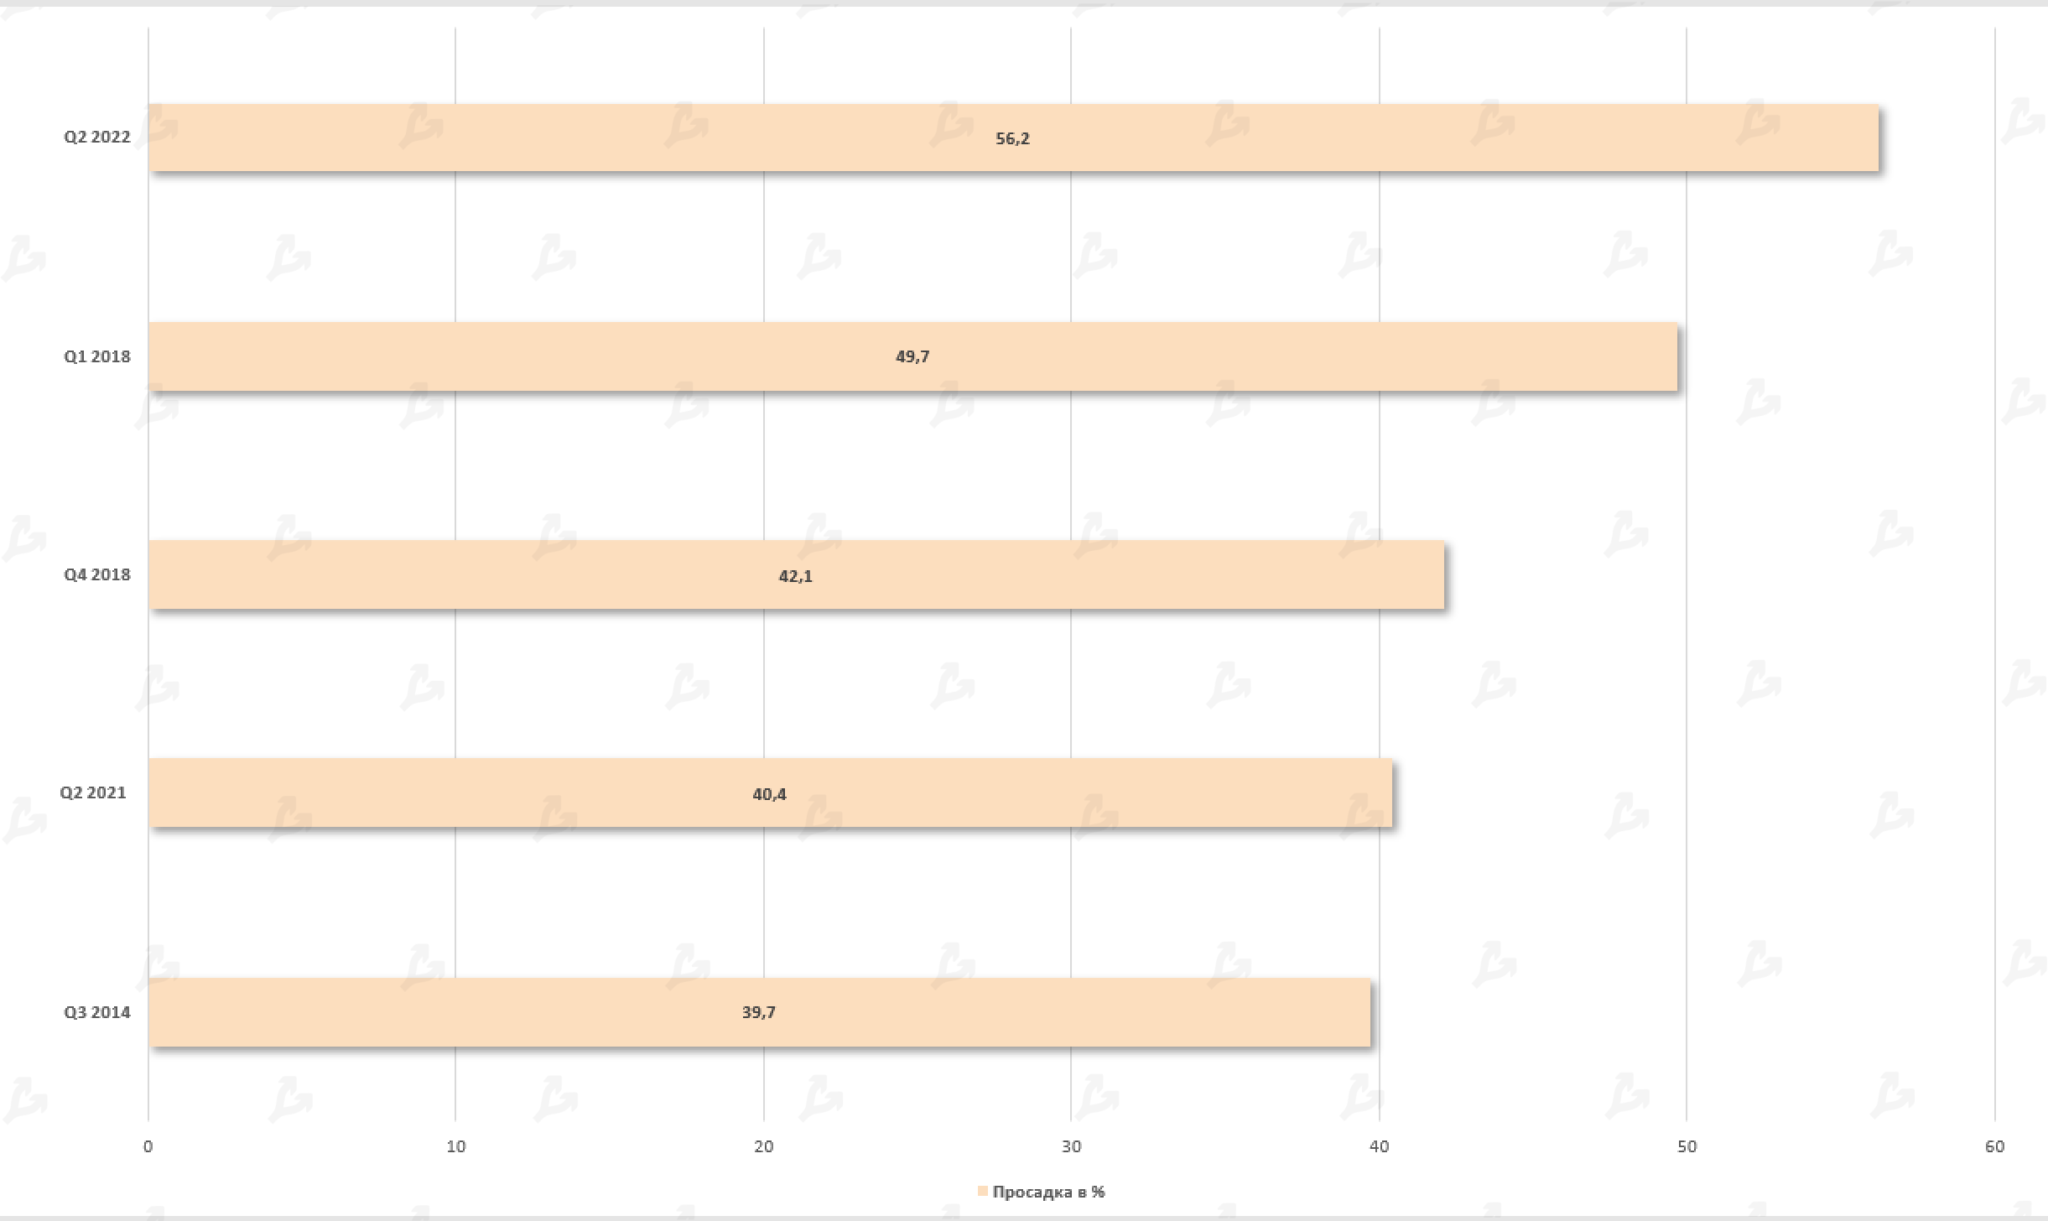
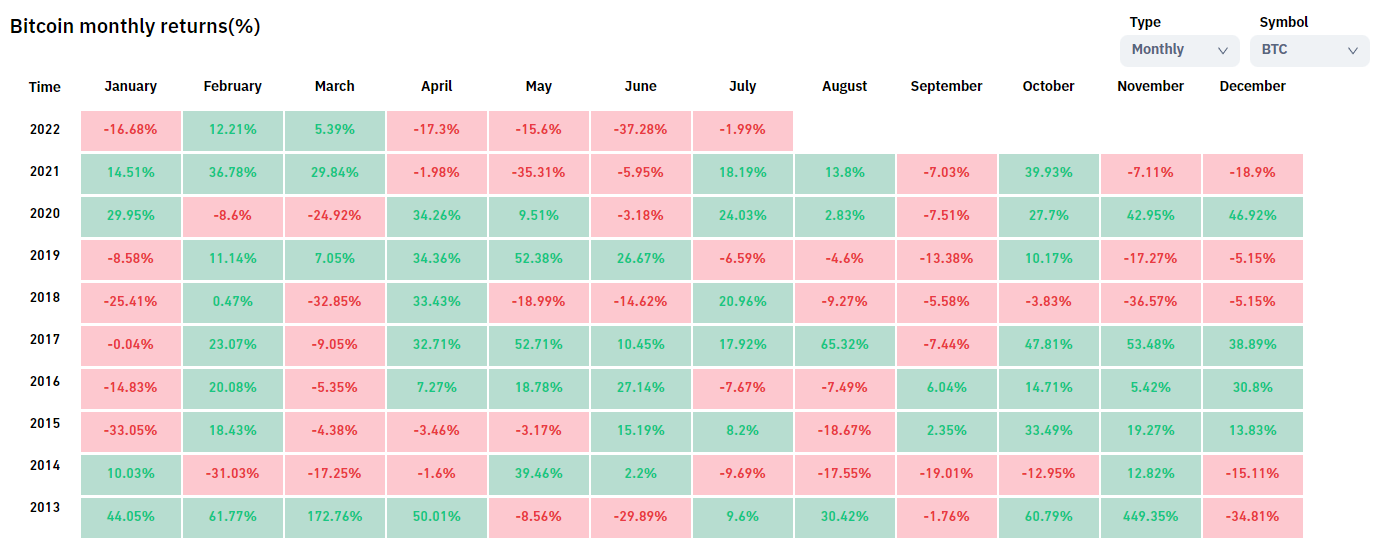
- At the end of the month, bitcoin sank by 37.3%. According to the results of the quarter (April-June) — by 56%.
- The cost of Ethereum in June fell by 44.8%, and by the end of the quarter — by 67.3%.
The negative dynamics caused by the collapse of Terra and UST were exacerbated by the problems of large companies — Celsius, BlockFi and Three Arrows Capital (3AC). As the bitcoin exchange rate fell, these players faced a liquidity crisis and found themselves on the verge of bankruptcy. Citing "extreme market conditions", Celsius stopped the withdrawal of funds by users. The stumbling block was the large loans of structures in DeFi-instruments and the inability to repay credit obligations.
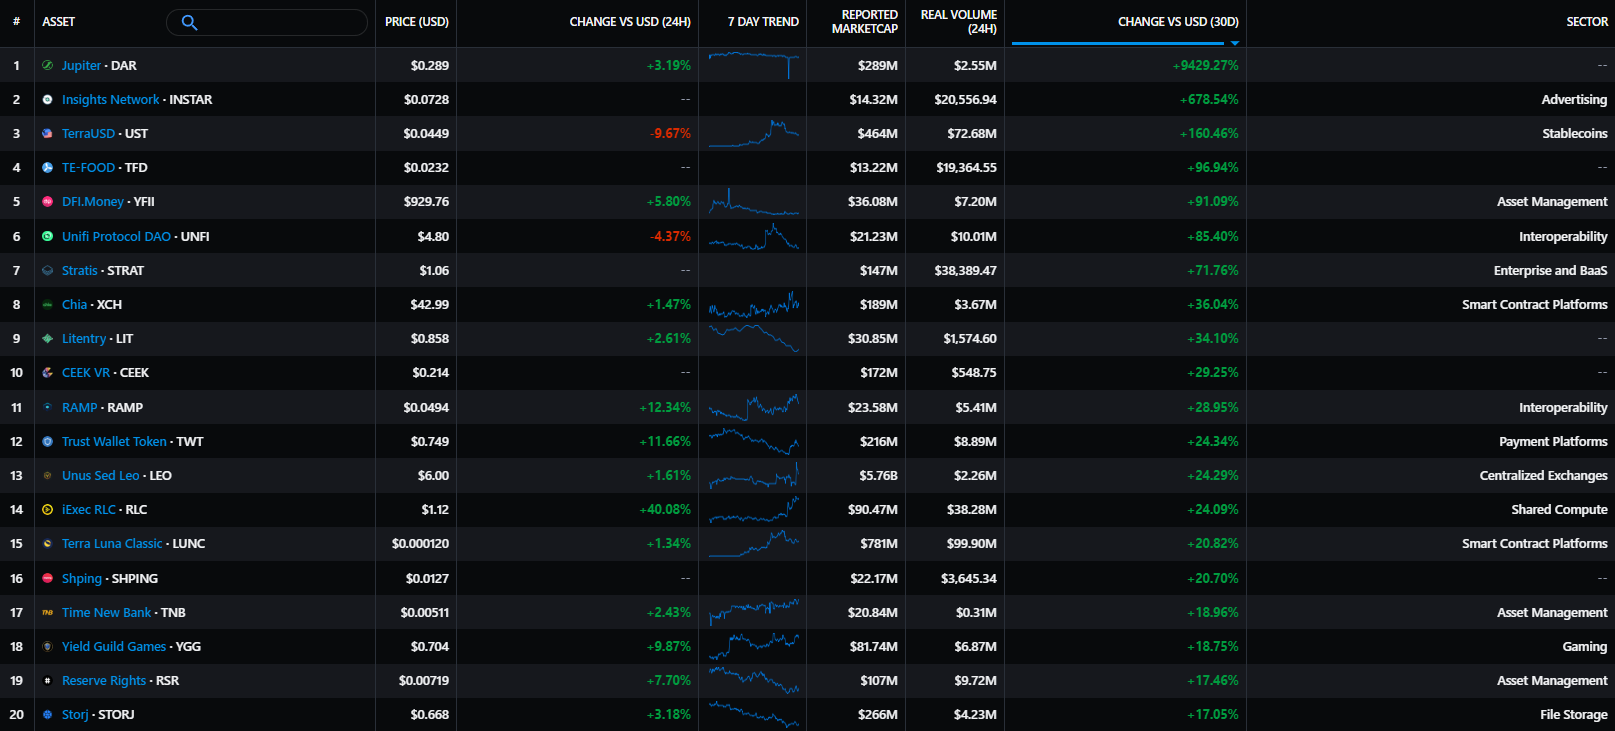
- Among the assets with moderate capitalization, Tara Classic (LINK) and TerraClassicUSD (USTC), Stratis (STRAT), Chia (XCH), Trust Wallet Token (TWT) and Unus Sed Leo (LEO) from Bitfinex showed positive dynamics.
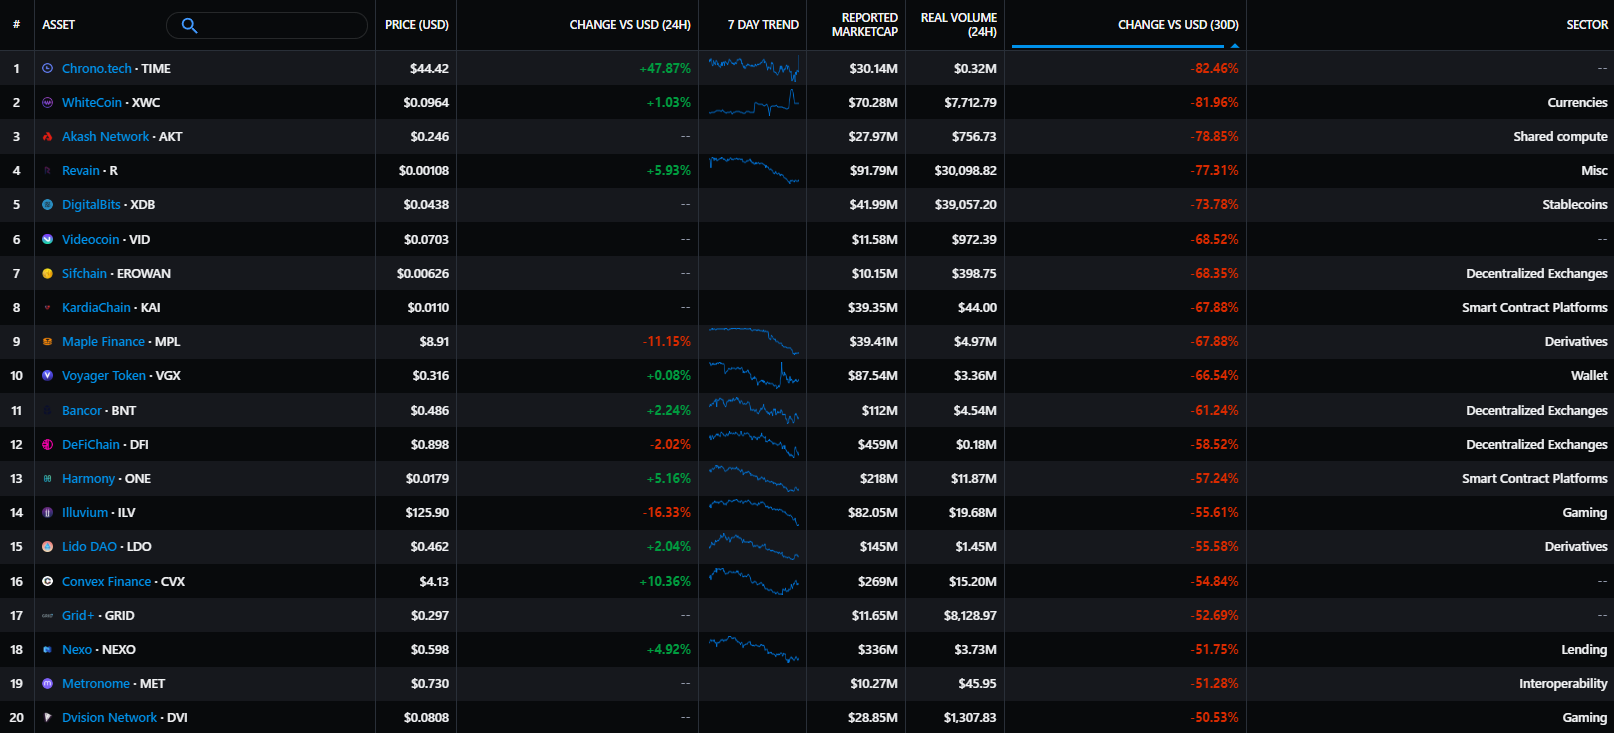
- The worst results were recorded by Voyager (GS), which provided the 3AC fund with $655 million in bitcoin and USDC stablecoin, and attacked by hackers Harmony (ONE) and Convex Finance (CVX). The negative dynamics was also shown by the token of the Lido protocol (LDO) — the issuer of the synthetic asset stETH that has lost its binding to ETH.
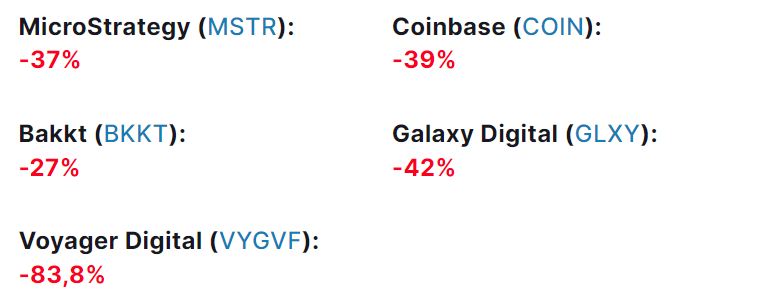
Cryptocurrency-related companies stocks price
Dynamics of securities of mining companies
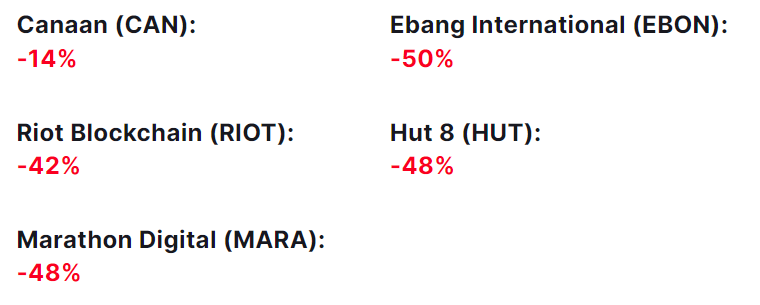
JPMorgan believes that mining companies in need of liquidity in the third quarter are able to continue to exert downward pressure on the bitcoin exchange rate if the profitability of mining does not increase. Public miners account for about 20% of the hashrate today.
Bloomberg reported that some mining companies have encountered problems in servicing loans secured by bitcoin mining equipment. The situation arose both due to the deterioration of market conditions and due to the negative revaluation of ASIC devices. Miner loans worth $4 billion are at risk of default.
Macroeconomic background
- Following the meeting in June, the Fed raised the key rate by 75 bps at once — to 1.5%-1.75%. The head of the Central Bank Jerome Powell warned that in July the step could be 0.5%-0.75%. Futures estimate the probability in the first case at 16.8%, in the second — at 83.2%.
- The Central Bank is ready to fight high inflation through a sharp slowdown in the economy. Macro statistics in June contained alarming signals, but did not unambiguously indicate the beginning of a recession. This "guarantees" a tightening of the Fed's policy in July and leaves it possible to raise the rate by 50 bps in September.
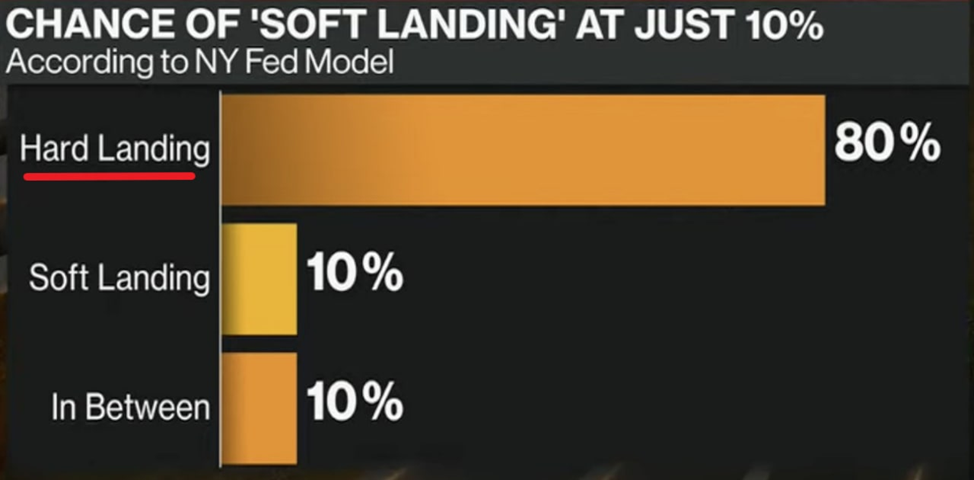
- The scenario of transition to negative GDP dynamics is becoming more and more relevant. The model of the Federal Reserve Bank of New York began to estimate the probability of a "hard landing" at 80%. In Europe, economists expect a recession by the end of the year.
- Historically, bearish equity markets in the United States have been observed during all periods of economic downturn. The Fed's transition to a policy easing cycle may push for a reversal. However, futures allow such a scenario no earlier than July 2023.
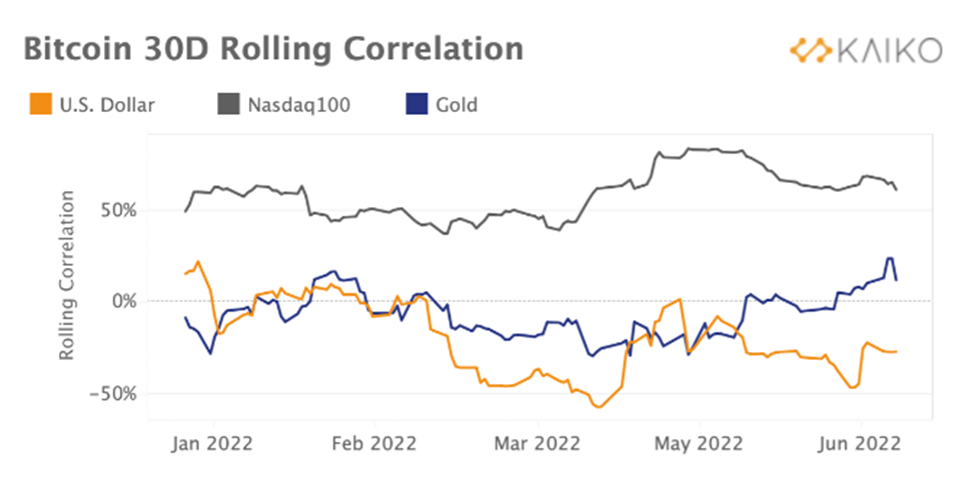
- The positive correlation of bitcoin with the Nasdaq-100 and the negative correlation with the dollar has moved away from the extremes, but still indicate a close price relationship of assets. According to the results of the second quarter, the technology index lost more than 20%, which leaves chances for a technical rebound. It may coincide with the start of a new quarterly reporting season.
Market sentiment, correlations and volatility
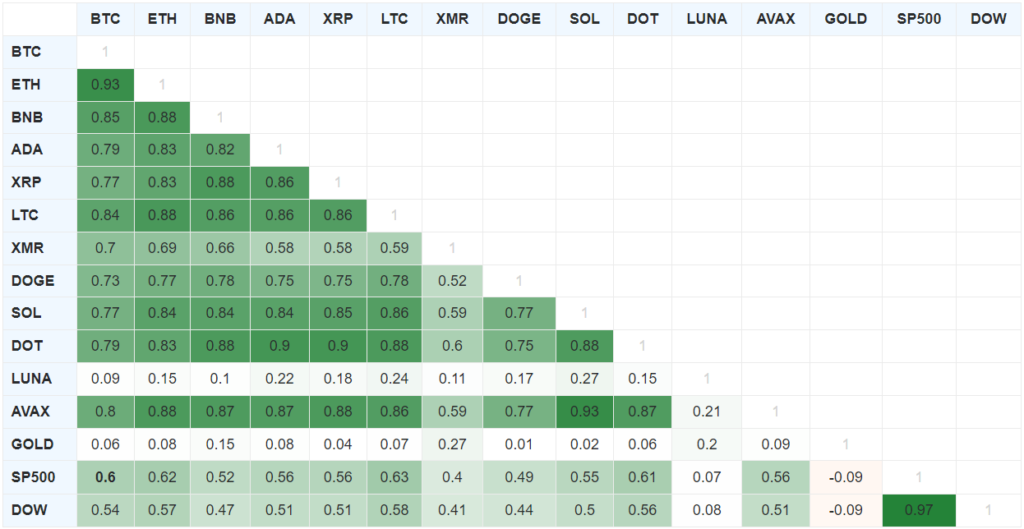
- In June, bitcoin's correlation with the US stock market strengthened. The smoothed 90-day moving average was 0.6 for the S&P 500 index and 0.54 for the Dow Jones.
- The statistical relationship of the first cryptocurrency with gold changed its sign to positive, but remained rather weak (0.06).
- By the end of the month, the correlation of the two largest digital assets has significantly strengthened. This indicates the presence of a strong trend in the market.
ETH Fee Dynamics
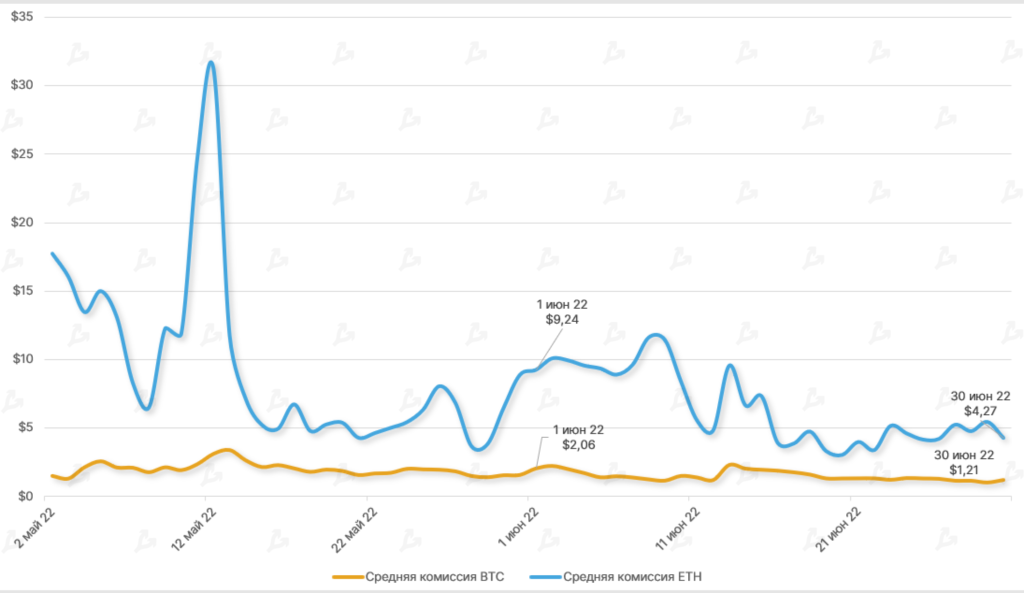
- Средняя комиссия за Ethereum-транзакцию снизилась за месяц на 53,7% — до отметки $4,27, сопоставимой со значениями июля 2021 года.
- Во второй половине июня средняя комиссия за биткоин-транзакцию не поднималась выше отметки $2.
- Основная причина столь низких значений — охлаждение ончейн-активности на фоне медвежьих настроений.
Trading volume
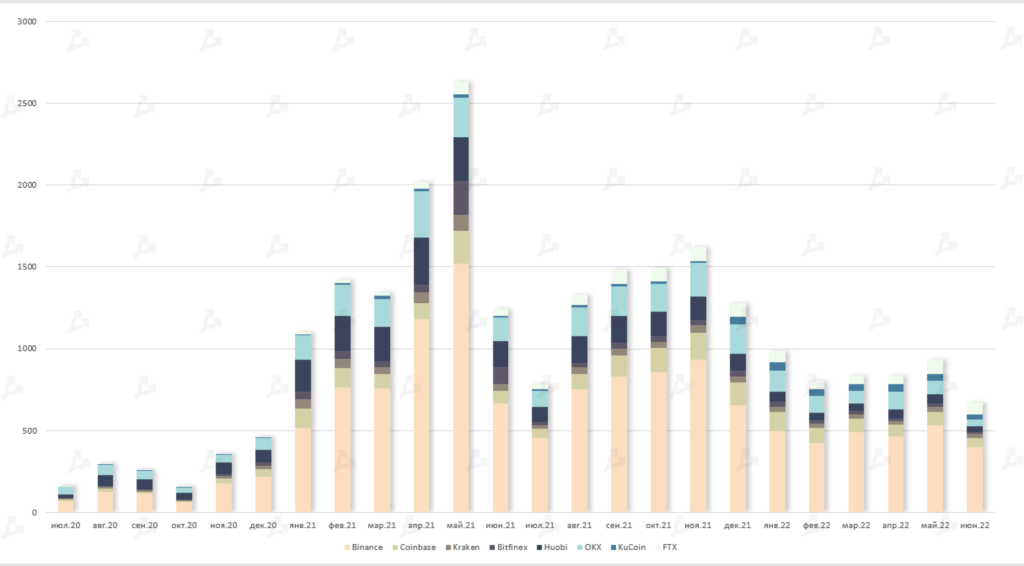
In June, the volume of trading on cryptocurrency exchanges updated the minimum since December 2020 at around $672 billion.
In terms of platforms, Binance remains the unchanged leader ($398 billion). FTX again outpaced Coinbase and OKX — $72 billion against $59 billion and $41 billion, respectively.
DeFi
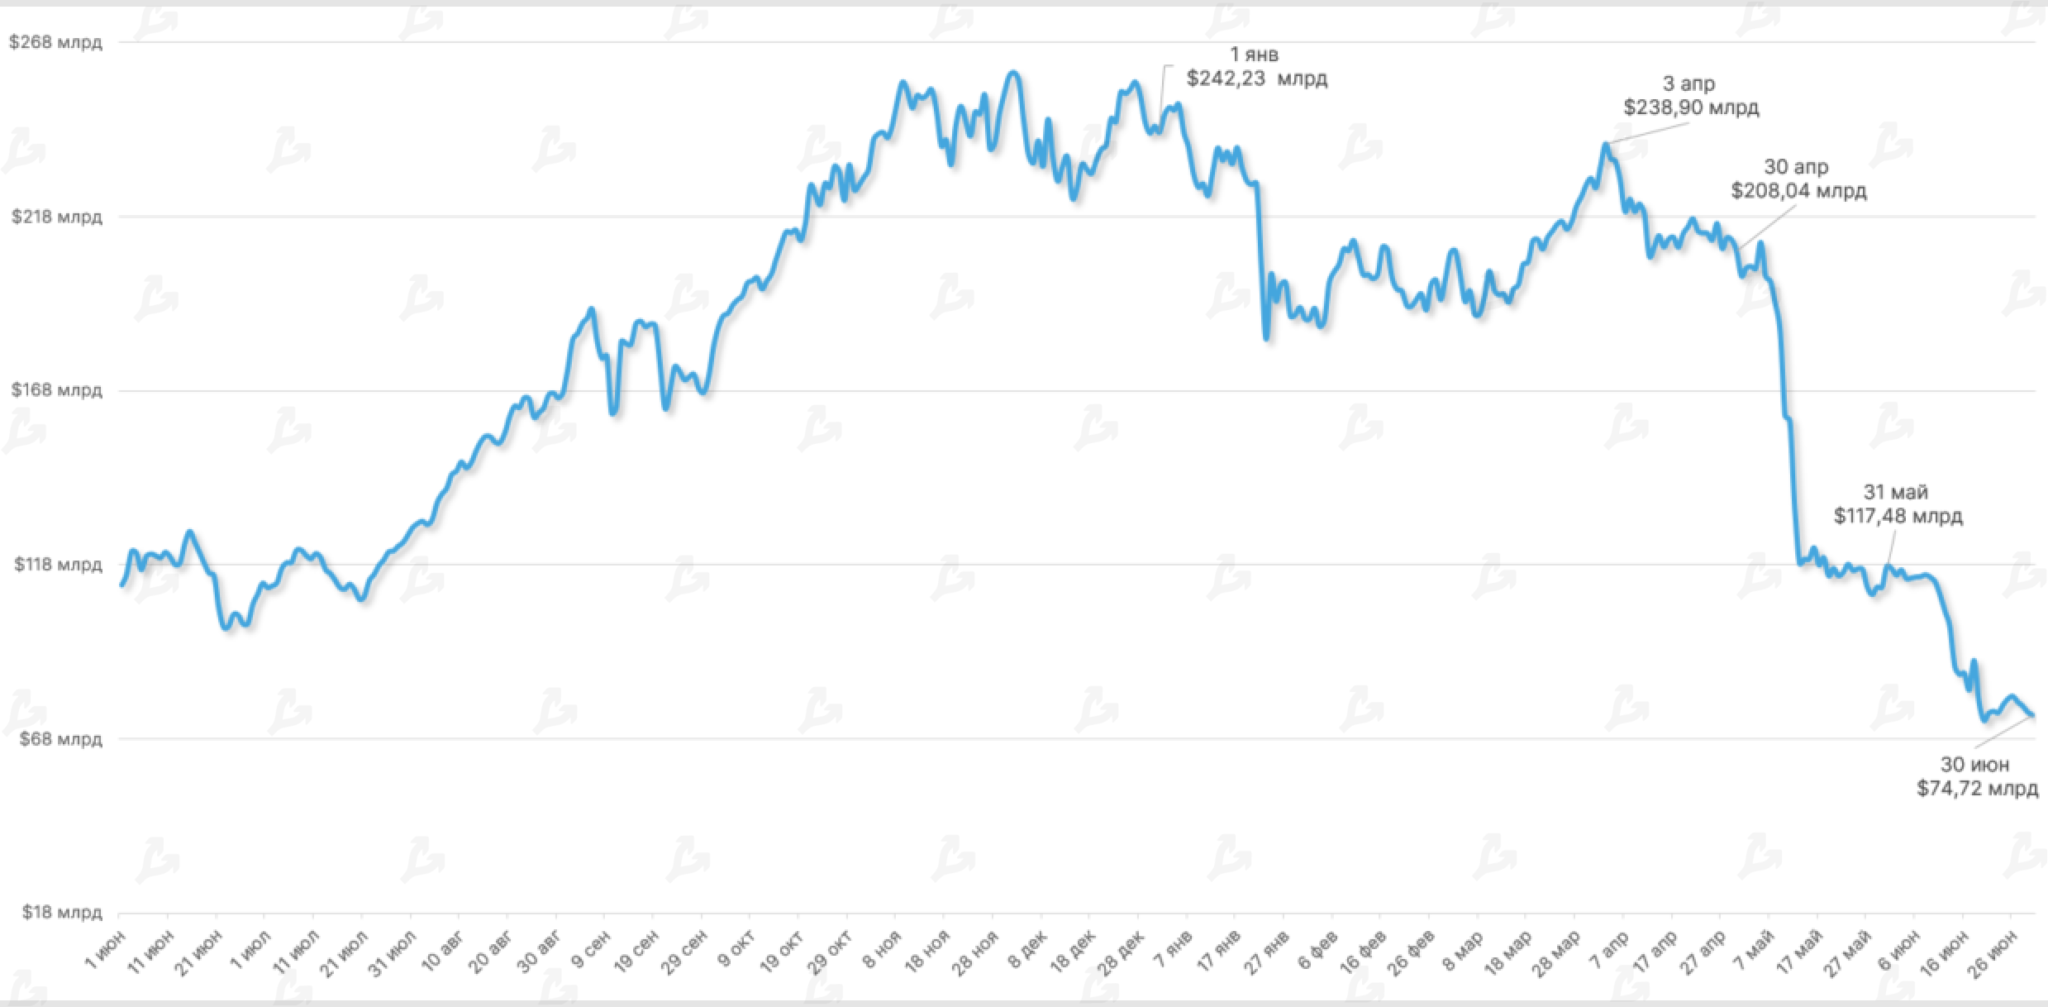
- In June, the volume of blocked funds (TVL) in smart contracts of decentralized applications decreased by 36%, to $74.72 billion. The reason is the crisis in the cryptocurrency market caused by macroeconomic factors, the problems of major industry players and the situation around stETH.
- The TVL of the permanent leader — Ethereum — fell to $42.83 billion ($71.98 billion in May). The indicator expressed in ETH, on the contrary, increased by 11% — 40.27 million ETH against 37.74 million ETH at the end of May.
- The Avalanche ecosystem came in third place in the volume of blocked funds. During the month, the inflow of liquidity into applications based on this network amounted to 111.32 million AVAX (+53% by May). This is partly due to the launch of a cross-chain bridge with bitcoin.
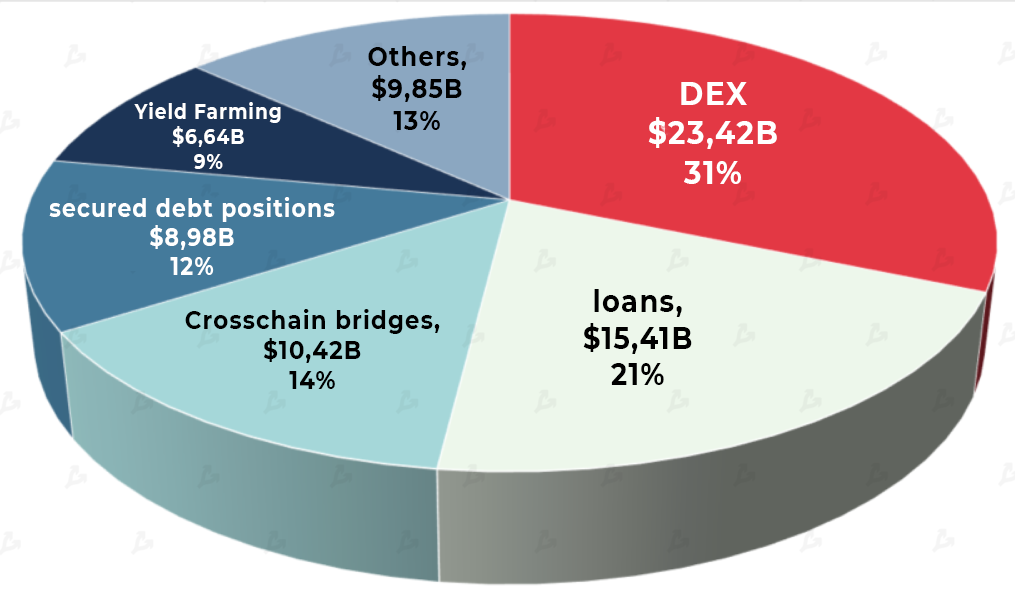
- In June, the dominance of the segment of decentralized exchanges in the total TVL of the DeFi sector increased. More than $24 billion is blocked in smart contracts of these applications (31% vs. 28% in May).
- Landing services with an indicator of $15.41 billion are in second place, and cross—chain bridges ($10.42 billion) are in third place.
- By the end of May, the total capitalization of "bitcoins on the air" fell to $5.89 — a reduction of almost half compared to the May figure ($ 10.15 billion).
- The WBTC dominance index is steadily holding above 85%. By the end of June, the capitalization of the asset amounted to $5.01 billion.
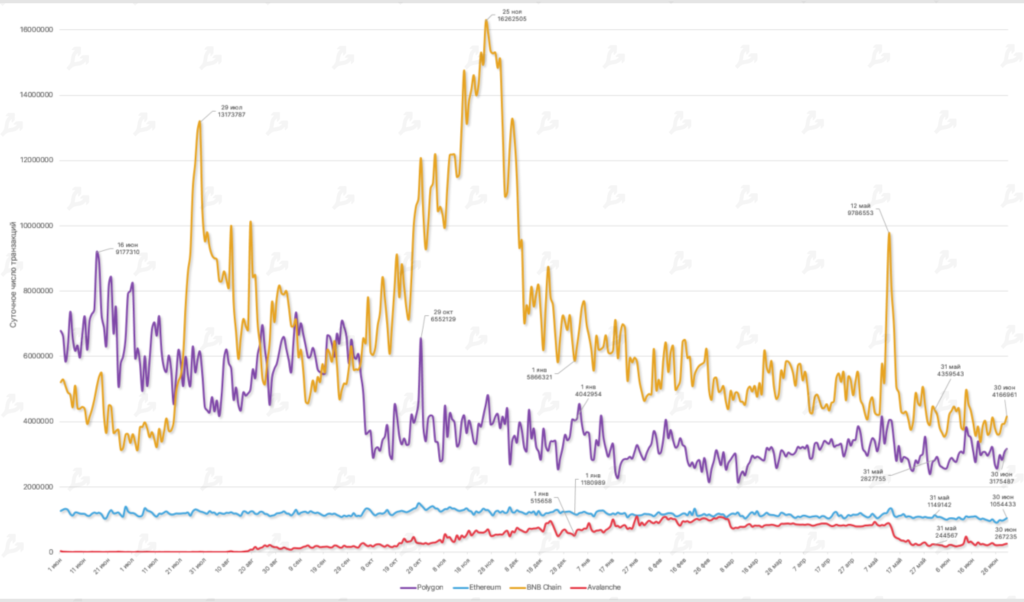
In June, the average daily number of transactions in all the networks under consideration decreased compared to May. In Ethereum, the indicator fell by 8%, BNB Chain — by 18%, Polygon — by 4.5%, Avalanche (excluding traffic in subnets) — 53%.
Activity of major players
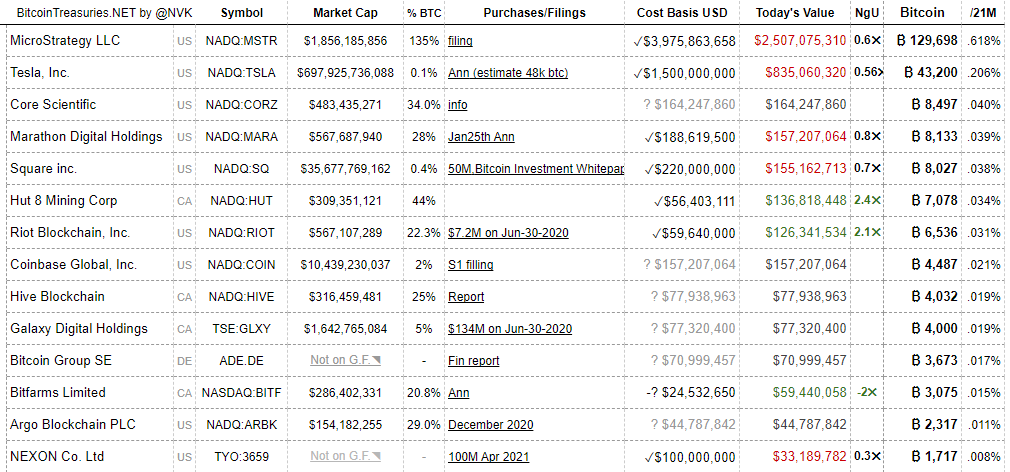
- MicroStrategy acquired an additional 480 BTC at an average price of about $20,817.
- As of 1.07.2022, the analytical software provider holds 129,698 BTC ($2.5 billion at the exchange rate at the time of writing) on its balance sheet. At the same time, the base cost of MicroStrategy investments is $3.97 billion. Thus, the "paper" loss of the company is almost $ 1.5 billion.
- Amid the drawdown, the government of El Salvador acquired an additional 80 BTC for a total of $1.52 million.
Statistics of the largest private pools on dHEDGE
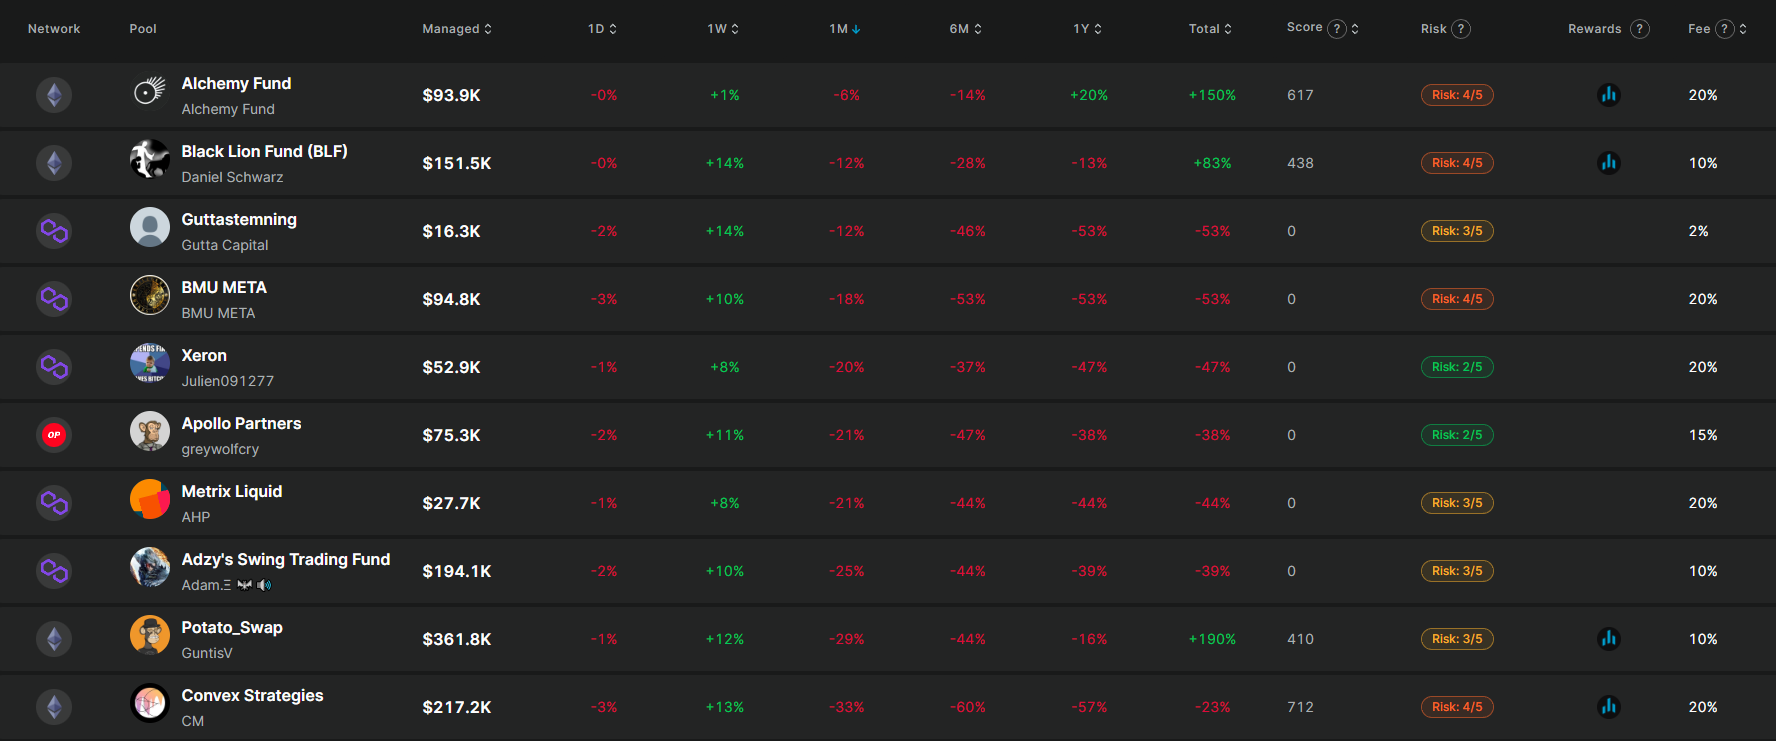
The crisis also affected the pools on dHEDGE. All pools that used non-stablecoin strategies lost more than 20% this month.