Manual on GG-Shot

Principle of operation of the indicator:
The main tasks of the indicator: - Indication of entry and exit points; - help in determining the change of trend; - help in timely reduction/increase of gained position.
Using the indicator you can avoid unpleasant situations that may arise for a trader due to inexperience, inattention, rush, etc. However, we should not forget that the indicator is not a 100% guarantee of profit and the current situation in the market, it should be evaluated using alternative methods of analysis.
The indicator makes it possible to exclude working with other indicators, as it combines several most popular oscillators and indicators, and as a result shows the user signals for buying, selling and fixing profits. This indicator is the result of long analysis and successful work in various markets.
Opening/closing positions using the indicator signals.
The indicator indicates positions: "SHORT" (Sell), "LONG" (Buy) and also indicates "TP" (Take Profit) to fix the position. It is recommended to use timeframes of 15 minutes and more to work with signals. The higher the timeframe value, the higher the probability of signal processing.
Opening/closing a long position ("LONG"):
When the "LONG" signal appears and is subsequently fixed to the next candle, enter the position. After entering the position, set the "TP" indicated on the indicator ("TP" is recommended to set within -30 points without reaching take profit). After the first "TP" is paid off, move the "SL" to at least break-even level.
Opening/closing a short position ("SHORT"):
When the "SHORT" signal appears and is subsequently fixed on the next candle, enter the position. After the first "TP" is paid off, move "SL" to at least break-even level.
Trade on timeframes of 1 - 5 minutes (scalping).
Open and close positions on small TPs in the same way as described above, but with some peculiarities:
Take Profit is fixed at the first take of 75%.
The position is closed completely when the reverse signal is fixed on the indicator.
ATTENTION!!! DO NOT TRADE AGAINST THE INDICATOR SIGNALS!!!
If most timeframes (especially from 1 hour and above) indicate a "LONG" signal, then it is necessary to stick to this position and refrain from entering the opposite position on the lower timeframes. If most signals indicate "SHORT", try to ignore "LONG" signals on the lower timeframes.
When trading assets with a daily volatility of more than 2% (BTC, ETH, etc.), consider the 15-minute timeframe the main one, but at the same time pay attention to the older timeframes. If the 15-minute timeframe is against the older timeframes, enter the trade with a smaller position.
*WHEN WORKING WITH THE INDICATOR, BE SURE TO ADHERE TO THE RULES OF RISK MANAGEMENT AND MANIPULATION!!! Responsibility for your actions and funds is borne only by you and no one else!!!
Connecting and setting up
Open any graph, for example https://www.tradingview.com/chart/?symbol=BITMEX: XBTUSD then click as shown in the picture and add the indicator to the graph.
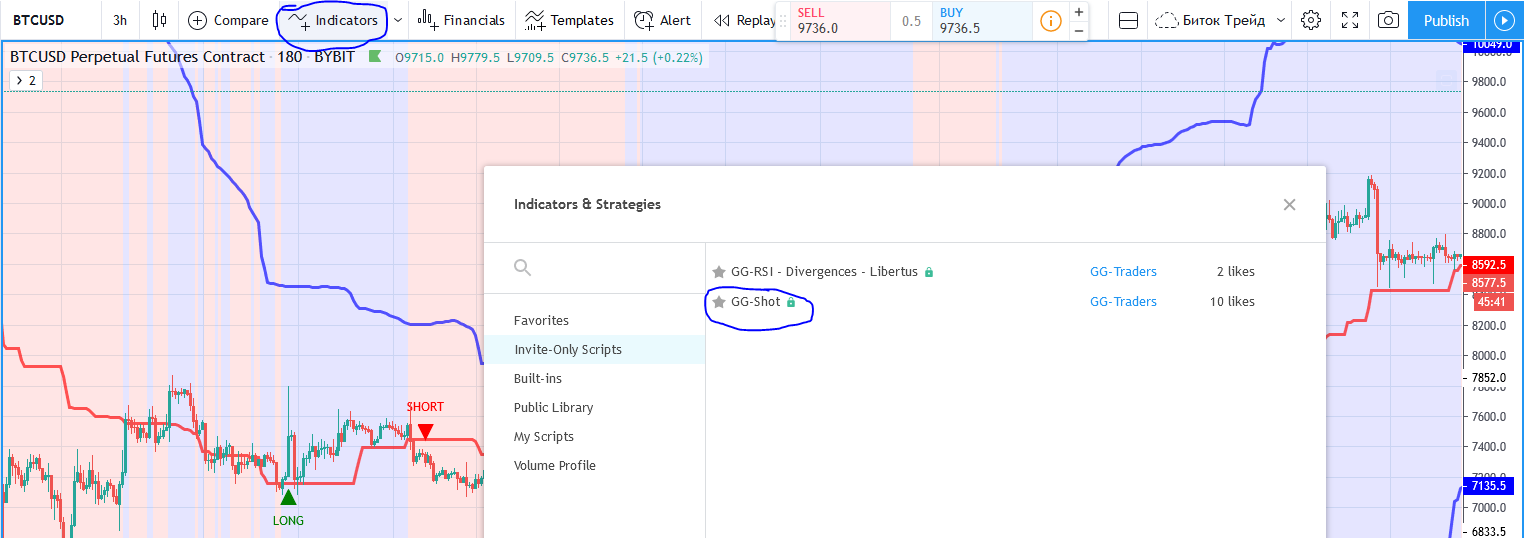
Then we select the required time frame for the selected strategy and configure the items marked in the screenshot below.

In practice.
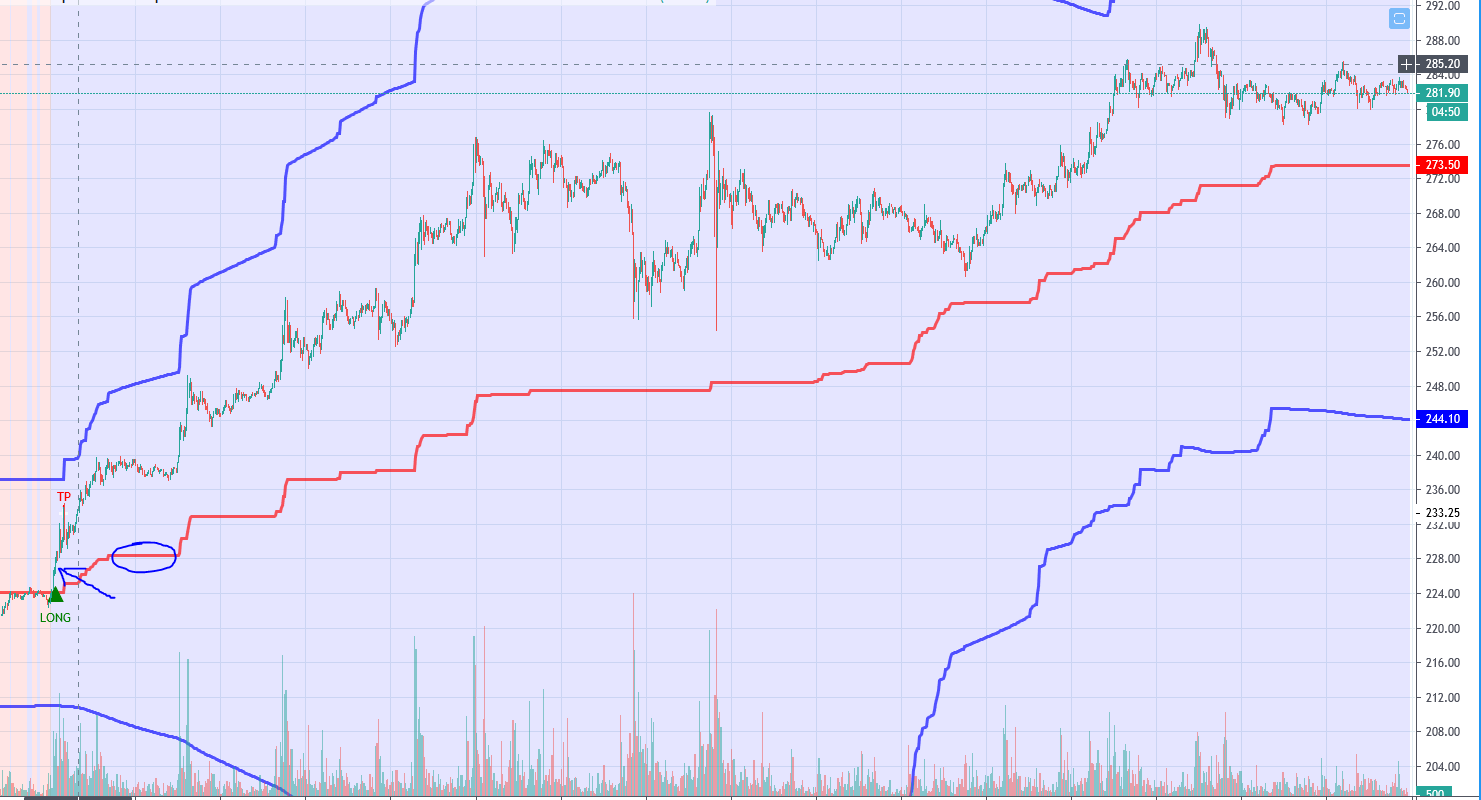
If there is a Bay or Cell signal, it is necessary to enter the position by 50 percent on the next candle when the signal is fixed on a certain time frame, as well as it is recommended to leave 50 percent increased position red line of the indicator, when reaching TP increased position should be removed.

Profit fixing takes place by TP or Fibo or Zone Margin as well as on the Reverse signal (fix on your view). Stop loss is placed behind the line with a slight distance from it (stop loss also serves as a return signal)