EDA
'' What in the world is the EDA? ''
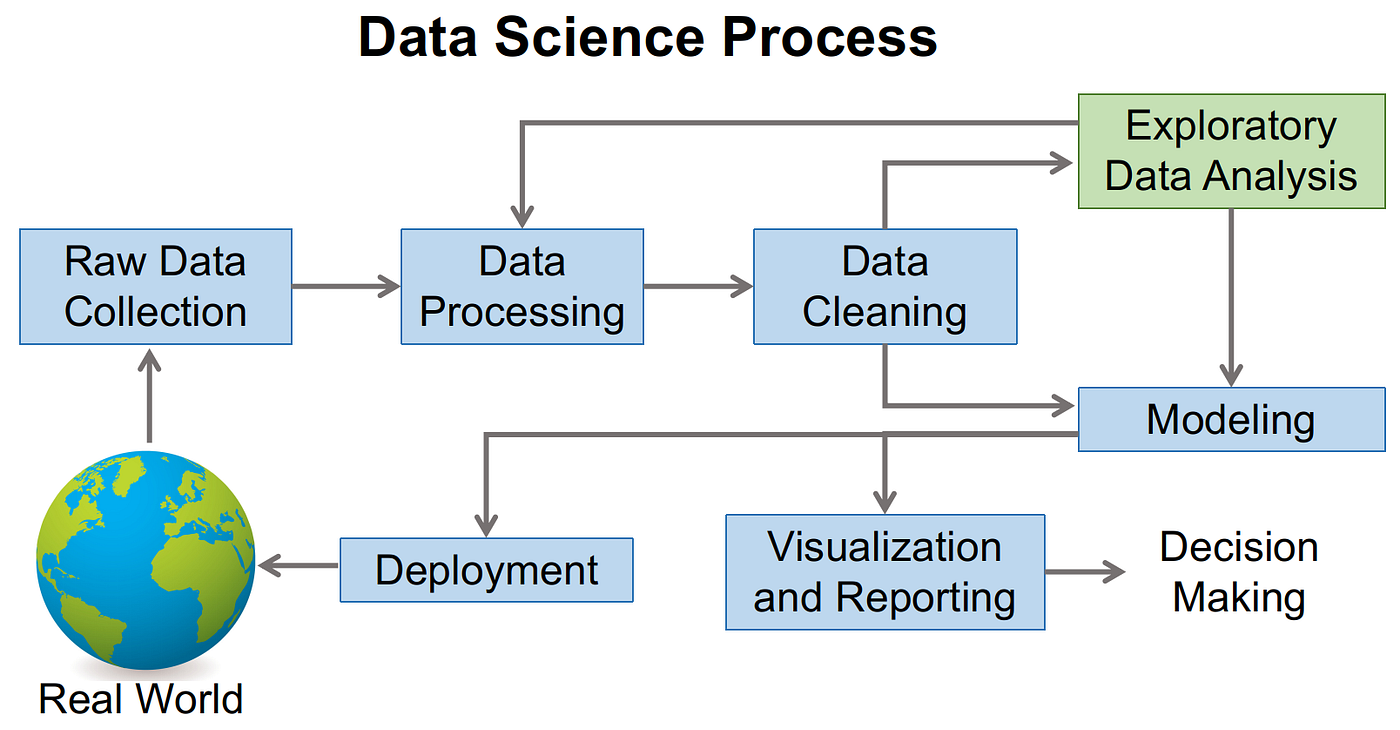
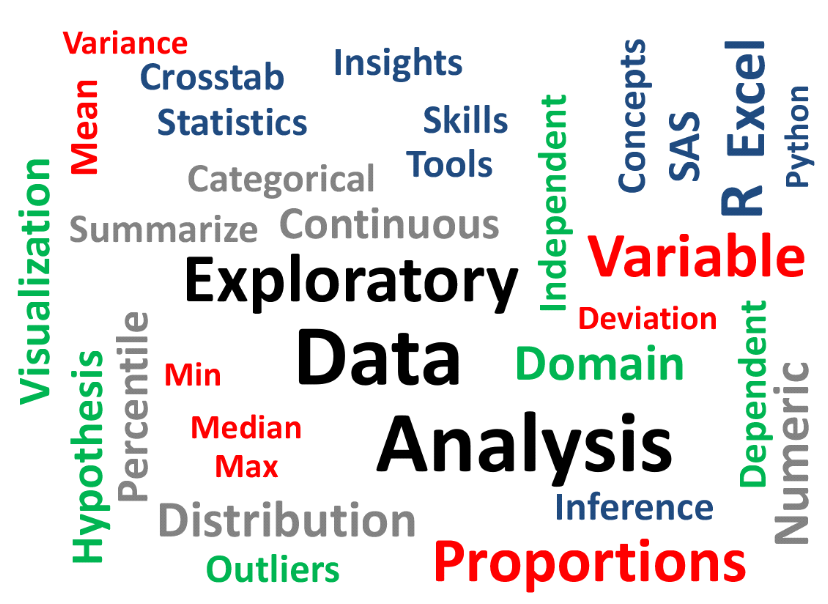
Developed in 1970s by John Tukey, EDA (Exploratory Data Analysis) can be said as the 1st step in data analysis process. When we talk about statistics, EDA is a summarizing of main characteristics of data sets by analyzing them. We may include visual methods that are often used together.
Example ⬇️
Let's say that you're going to learn a new field in IT, and things to consider before making a decision of starting out would be:
- Whether that way can give you solutions to your problems or not.
- Finding appropriate materials such as documentations, videos, or tools the can make it easy for you to advance.
- Can you make it happen at the moment of starting, and can you spend some amount of your time on learning?
- etc...
Let's continue 🎮
Similar to this, when you're about to build a machine learning model, you have to be fine with your data whether it's making sense or not. EDA helps getting confidence in our data a point where you're ready to use some ML algorithm.
Why do we do EDA? 🙋♂️
EDA is important before taking a leap to ML or modeling your data. Performing that, we get information whether:
Once we have done with EDA and taken important insights, that's feature can be used for unsupervised and supervised ML modeling.
In any ML workflow, you have to provide insights to stake holders in the last step. It is possible to explain every piece of code, but what about the audience? The audience can understand what our data is about and what insights we got from exploring data by referring to the plots, heat-maps, graphs, and so on, after the completion of EDA.
Coming to our last example, we can say that there will be enough interest in our fiends to go with us in our chosen field due to the details provided before making a decision.
Steps in EDA 🪜
There are many steps for performing EDA. Let's see just some of them:
- Description of data (we need to know the various kinds of data and other stats of the data)
- Handling missing data (real-world data is not always clean and homogeneous)
- Handling outliers (detecting something separate or different from the crowd)
- Understanding relationships and new insights through plots (by visualizing data set, getting many relations)
Tools used for EDA 🔎
For automating the steps of predictive modeling like data cleaning and data visualization, there are many open-source tools such as Tableau, Excel, Weka, Qlikview, and so on.
We can do EDA, in programing, using R, SAS, and Python, and the important packages in Python are:
What if we don't use EDA at all? ❌
That will be a mistake with many implications:
- generating inaccurate models
- generating on the wrong data
- not creating the right type of variables
- using resources inefficiently
So, don't be in a hurry and think carefully in every step since most of the things depend on your actions, my friend 😉
We're not done with EDA but only starting. Let's use its power and make ourselves powerful 💪
Credits
I want to express my gratitude to the website towardsdatascience.com and especially sunil kumar for providing an awesome explanation about EDA with the title of "Exploratory Data Analysis …A topic that is neglected in Data Science Projects".