Statistics
Statistics templates is a great tool for detailing analyze and accurate setting of your campaigns. Statistics allow you to have an understanding of how successful the launched campaign is, depending on the intermediate results, allows you to correctly optimize and configure the campaign in detail for further work.
Choose “Statistics” in Main menu
There will be following data:

- The number of lines on one page
- Here you can set a custom time period when suggested filters don't fit
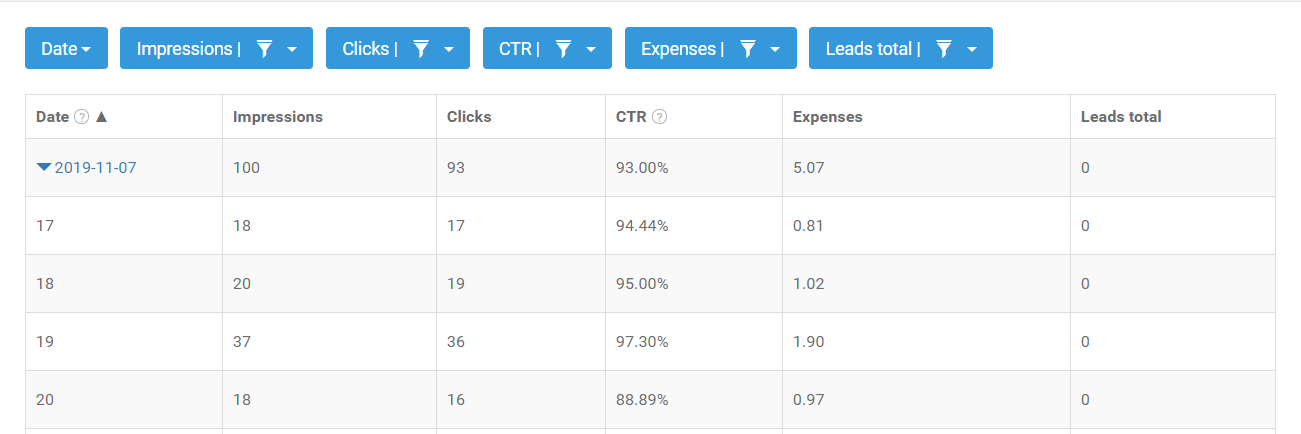
- There are some default templates: “Today”, “Yesterday”, “7 days”, “30 days”, “This month”, “Last month”. They include “Date”, “Impressions”, “Clicks”, CTR, “Expenses” and “Leads total” filters:

4. For deeper analytics you can view statistics by the hour

5. Chosen filters and displayed values:
Side bar on the left shows “In use” and “Not in use” filters:

The statistic report will be formed according to filters ‘In use’. You can drag-and-drop the filter button from the left column to the page center to add it. If you want to add filter column in your statistic table, you can drop it to the field with available filters:

You can drag the filter button beyond the page borders to remove it:

To find the necessary filtre, you can use search box to speed up the process:

You can narrow down the target by using additional settings inside each button:


After making all changes you need to click on “Apply” to show new data.
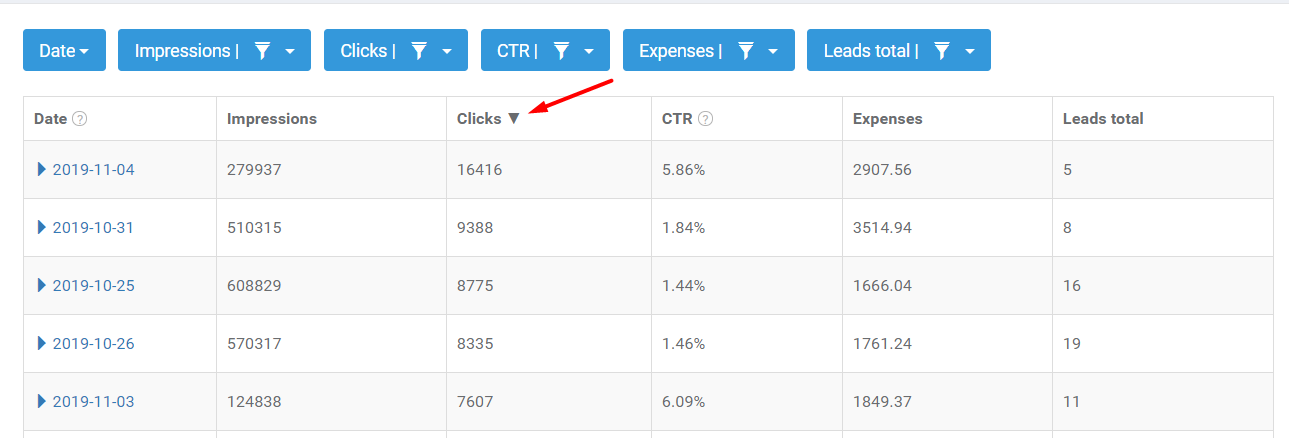
You can sort the data by columns clicking on its name:
6. To get the report press "Download" button and choose the format you prefer (csv or xlxs):

7. Every custom parameter selection can be saved in your templates for quick and easy access. Just click "Save" button where you can put a name, select a period and mark the checkbox if you want this template to be a default:

All created templates are available for viewing, editing and deleting in the “Statistics” menu:

Also you can use some standard templates such as “By dates”, “By campaigns”, “By creatives”, “By types”, “By source’s subject”.
8. To start from scratch hit "Reset" it removes all filters besides "Date"
Available filters:
- Date - filters by date
- Creative - displays statistics by certain creative (id)
- Campaign - filters by campaign id
- SSP - you can sort impressions by SSP
- Source ID - displays the list of sources you had impression on
- User Audience - filters by types of audiences, effective analytics tool. Here you can see gender distribution by categories for the fine tuning of your campaigns.
- Type - type of your ad (clickunder, push notifications)
- OS - filter by operating systems (Android, Windows, etc.)
- Browser - sort by different browsers
- GEO - displays the list of countries
- Language - shows languages of users devices
- Subscription age - days passed since user subscribes to notifications
- Impressions - amount of impressions
- Trades - amount of trades your creatives were in
- Clicks - number of clicks on your creatives
- CTR - ratio clicks to impressions in percents
- eCPM - actual cost of 1000 impressions
- Leads total - number of leads for all or chosen campaigns
- RPM - income for 1000 impressions
- Win Rate - ratio wins/biddings in percents
- Profit - income minus expenses
- CR - ratio target actions/all actions in percents