Technical analysis
Technical analysis is a powerful evaluation tool that can be utilized by any investor before making any investment decision. Whether you’re trading Bitcoin, Ethereum, or any other coin, you should consider adding it to your investment strategy. Employed by investors to interpret momentum signals produced by the market, technical analysis assists traders in forecasting the price movements of an asset.
Although technical analysis can’t replace fundamental analysis, all investors can greatly benefit from the use of it to improve the timing of their investments.
Fundamental vs Technical Analysis
Prudent investors use a combination of fundamental and technical analysis to make educated decisions. Fundamental and technical analysis differ both in the types of information they consider and also the general length of trends they predict.
While fundamental analysis is centered on calculating the underlying value of the coin, technical analysis is mostly unconcerned with a coin’s intrinsic value. Instead, technical analysis attempts to the predict the future price movement of an asset solely based on past trading data and market sentiment.
Fundamental analysis is typically more helpful in predicting the slower moving long-term trends of a coin. On the other hand, technical analysis tends to be more useful in determining the short-term rapid price movements of a coin.
Technical Analysis Basics
Based on the principle that short-term price movements are not truly random, technical analysis asserts that all publicly available information about an asset should already be reflected in that asset’s market price.
In other words, technical analysis claims that past trading data of an asset is a better indicator of a coin’s future short-term price movements than the actual intrinsic value of the coin itself.
Directional Trends
A trend is an observable directional bias in the price movement. During a trend, the price of an asset moves in a specific direction that’s expected to continue. Trends are typically classified into three directions: upward, downward, or sideways.
Upward trends are sometimes referred to as bullish. Likewise, downward trends are bearish. These adjectives are derived from the way each animal tends to fight; a bear typically swipes down with claws, meanwhile, a bull usually thrusts up with its horns.
Technical Analysis Origins
Technical analysis was pioneered by Charles Dow, who often wrote about the subject in his editorials of the Wall Street Journal throughout the 19th century. Dow’s writings collectively began to be known as Dow Theory.
Although Dow Theory has been refined by several writers over the past century, Dow’s writings still provide the basis of modern technical analysis. The main principles of Dow Theory are listed below:
Dow Theory Main Tenets
· The market price of an asset already considers every factor that may influence the asset’s price.
· Price movements of an asset are not purely random. Instead, prices tend to move in observable patterns and trends that repeat over time.
· Volume movement normally confirms trends. A price trend is confirmed by an increase in volume; likewise, a decrease in volume, signals that a trend is weakening.
· Trends continue until a clear reversal occurs. Dow Theory warns investors to not confuse longer-term primary price trends with shorter-term correctional secondary trends.
Technical Analysis Categories
Technical analysis often uses a combination of chart patterns, indicators, and other statistical trading information to determine a coin’s future price trend.
Technical analysis can be divided into two main categories of chart patterns and indicators.
Chart Patterns
Chart patterns are distinct formations created by a security’s price movements over time on a chart. Distinct chart patterns are thought to be repeated due to market and investor psychology.
Definitions of trading patterns can be quite subjective as different traders may have differing opinions on what specifically constitutes a recognizable pattern. It’s also important to note that some chart patterns are more accurate than others.
As no chart pattern is perfectly accurate, an investor should use them in combination other with other technical indicators to reduce the statistical error of predictions.
Chart Patterns can be divided into two main categories of continuation patterns and reversal patterns.
Continuation Chart Patterns
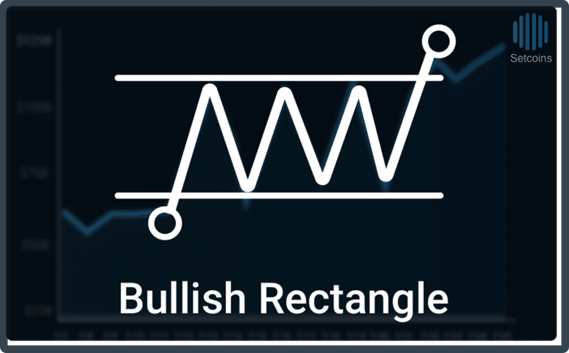
Continuation patterns indicate that the primary trend is likely to continue following the pattern’s completion. For example, if an asset is currently in the middle of an uptrend, a continuation trading pattern would signal that upward movement is likely to continue after completion of the pattern.
Common Continuation Chart Patterns
· Triangles
· Flags
· Pennants
· Rectangles
Reversal Chart Patterns
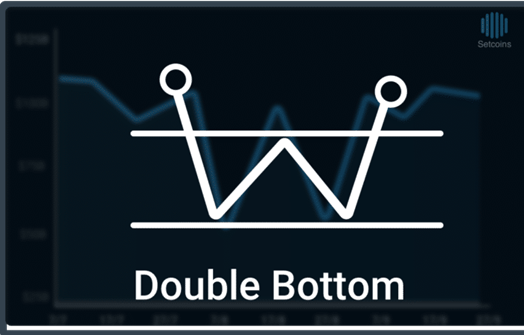
Reversal patterns indicate the primary trend is likely to reverse following the pattern’s completion. For example, if an asset is currently in the middle of a downtrend, a reversal trading pattern would signal the likely end of the primary downtrend and the beginning of an overall uptrend after the pattern’s completion.
Common Reversal Chart Patterns
· Head and Shoulders
· Inverse Head and Shoulders
· Double Top
· Double Bottom
Indicators
Indicators are mathematical calculations normally based off an asset’s price or volume used by investors to predict future price movement of the asset.
Types of Indicators
The most common type of indicator is called an oscillator. Oscillators are bounded within a set number range, most commonly 0 to 100. In addition to oscillators, some indicators are nonbounded.
Indicators can be mainly divided into two categories of leading indicators and lagging indicators depending on when they signal.
Leading Indicators
Creating momentum signals before price movements, leading indicators are used by investors and traders alike to help determine future price movement of a coin.
Leading indicators are most helpful during periods of sideways trends or periods of no trend at all. They help traders determine moments when an asset’s price will mostly breakout or breakdown in a new trend.
Two of the most commonly used leading indicators are the Relative Strength Index (RSI) and Stochastics Oscillator.
Relative Strength Index (RSI)
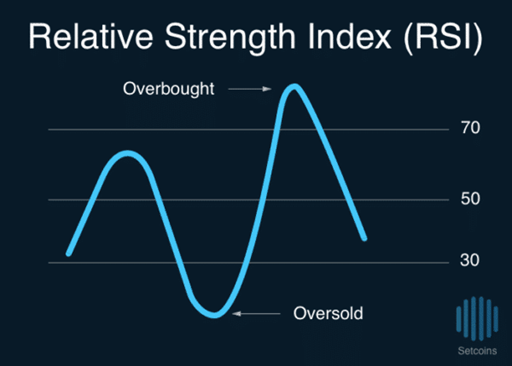
Ranging from 0 to 100, RSI is a momentum indicator that compares the sizes of recent gains and losses over specified time to measure the price change of a security.
The RSI indicator is mostly used to identify if a security is overbought or oversold. A reading of over 70 means that a security is overbought while a reading below 30 indicates that a security is oversold.
Stochastic Oscillator
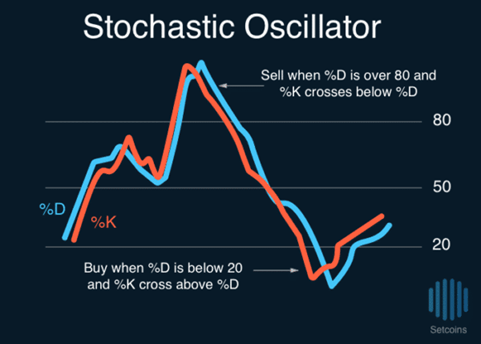
The stochastic 0scillator is a two-line momentum indicator comparing the closing price of an asset to a range of prices over a specified length of time. The stochastics oscillator normally uses the last 14 days of trading data to calculate its score.
Similar to RSI, the stochastic oscillator ranges from 0 to 100. Readings of over 80 indicate that a security is overbought while readings under 20 indicate that a security is oversold.
The stochastic oscillator is made up of two lines, the %K and the %D. %K measures the momentum of the asset while %D measures the three-day simple moving average of %K. Buy and sell signals are created when the %K line crossovers over %D line.
Lagging Indicators
Coming after a price movement as already occurred, lagging indicators mostly act as a confirmation tool utilized by investors to determine if a price trend will continue or weaken. Unlike leading indicators, lagging indicators are most insightful during periods of trending prices and produce less actual buy or sell signals compared to leading indicators.
Two of the most commonly used lagging indicators are Moving Averages and Bollinger Bands.
Moving Averages
Several different moving averages are utilized in the technical analysis:
Simple Moving Average (SMA) – The simple moving average is simply the sum of all of the past closing prices over a specified period divided by the number of days in the period. For example, a 20-day simple moving average would be the sum of the last 20 closing prices of an asset divided by 20.
Exponential Moving Average (EMA) – The exponential moving average is calculated in similar fashion to the simple moving average but more weight is given to recent closing prices over former closing prices.
Moving Average Convergence Divergence (MACD) – The MACD is calculated by subtracting the 26-day exponential moving average from the 12-day exponential moving average. MACD indicates the direction of momentum rather than the direction of an asset’s price. When positive, the MACD indicates that momentum is moving upward; likewise when negative, the MACD indicates that momentum is moving downward.
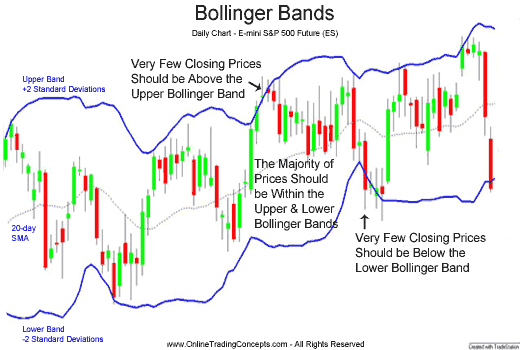
Bollinger Bands
Plotted two standard deviations away from the simple moving average of a security, Bollinger Bands provide investors several cues about the price volatility of a security.
The width of the Bollinger Bands is thought to describe the predicted volatility of an asset’s price. As Bollinger bands widen, periods of high volatility are indicated. As Bollinger bands narrow, periods of low volatility are indicated.
Additionally, the more the simple moving average moves closer the upper band, the more overbought the security is deemed to be. Similarly, the more the simple average moves closer the lower band, the more oversold the security is deemed to be.
Conclusion
Although not a replacement for fundamental analysis, technical analysis is an important evaluation tool that can assist an investor in the timing of any investment decision.
In contrast to fundamental analysis, technical analysis doesn’t consider the coin’s intrinsic value when attempting to predict future price movements. Instead, technical analysis hopes to forecast short-term price moments based solely on past trading data and market sentiment.