HAQQ validator monitoring, notification and protection system
This article will tell you how to set up the cosmos node monitoring, the alert system, as well as how to improve your security.
The guide is written on the example of the HAQQ project.
PANIC Bot
PANIC is an open source monitoring and alerting solution for Cosmos-SDK, Substrate and Chainlink based nodes by Simply VC. The tool was built with user-friendliness in mind, and comes with numerous features such as phone calls for critical alerts, a UI Dashboard, a Web-UI installation process and Telegram/Slack commands for increased control over your alerts.
If you want to dive into the design and feature set of PANIC click here.
Official guide – https://github.com/SimplyVC/panic.
Validator Server
Open RPC endpoint
Change node config (in our case - HAQQ). For other projects – use specific paths (usually – $HOME/.project/config/config.toml)
nano ~/.haqqd/config/config.toml
In block RPC Server Configuration Options for the RPC server to listen on, change laddr value
laddr = "tcp://0.0.0.0:26657"
Install node-exporter
wget https://github.com/prometheus/node_exporter/releases/download/v1.3.1/node_exporter-1.3.1.linux-amd64.tar.gz
tar xvfz node_exporter-*.*-amd64.tar.gz
sudo mv node_exporter-*.*-amd64/node_exporter /usr/local/bin/
rm node_exporter-* -rf
sudo useradd -rs /bin/false node_exporter
Then we need to create a systemd service for our app:
sudo tee <<EOF >/dev/null /etc/systemd/system/node_exporter.service
[Unit]
Description=Node Exporter
After=network.target

[Service]
User=node_exporter
Group=node_exporter
Type=simple
ExecStart=/usr/local/bin/node_exporter

[Install]
WantedBy=multi-user.target
EOF

sudo systemctl daemon-reload
sudo systemctl enable node_exporter
sudo systemctl start node_exporter
Monitoring Server
Check if Python3 is available on your server. Python is preinstalled in most distributions.
python3 --version
sudo apt-get install python3-pip redis-server -y
sudo pip3 install pipenv
sudo systemctl enable redis-server.service
Create user and directories for PANIC, clone repository:
adduser panic_alerter
mkdir /opt/panic_alerter
chown -R panic_alerter:panic_alerter /opt/panic_alerter
su panic_alerter
cd /opt/panic_alerter
git clone https://github.com/SimplyVC/panic_cosmos.git
cd panic_cosmos
git checkout master
pipenv update
pipenv run python run_setup.py
During the interactive setup, you will be prompted to enter a set of data.
First one - unique identifier:

Next step - setting up alert. Let's take the setting of alerts in Telegram as an example.
When prompted to configure them, press Y.

Create a bot and get the necessary data can be here, in this guide will not be a detailed explanation. In the screenshot you can see an example of a test alert

Setting up monitoring
Also during installation, the script will prompt us to enter the data of the node we want to monitor.

Create Service file
printf "[Unit]
Description=P.A.N.I.C.
After=network.target
StartLimitIntervalSec=0

[Service]
Type=simple
Restart=always
User=panic_alerter
TimeoutStopSec=90s
WorkingDirectory=/opt/panic_alerter/panic_cosmos
ExecStart=/usr/local/bin/pipenv run python /opt/panic_alerter/panic_cosmos/run_alerter.py

[Install]
WantedBy=multi-user.target" > /etc/systemd/system/panic.service
sudo systemctl daemon-reload
sudo systemctl enable panic
sudo systemctl start panic
sudo journalctl -u panic -f

Example
For demonstration purposes, I stopped one of the nodes. The result is in the screenshots below.


Grafana + Prometheus
For monitoring we will use Grafana + Prometheus. We will need a separate server to configure monitoring and, accordingly, a server with a validator node.
A number of changes need to be made both on the server side with the validator and on the server side that serves as the monitoring center of our system.
Validator Server
Enable Tendermint Metrics
sed -i 's/prometheus = false/prometheus = true/g' /root/.haqqd/config/config.toml
After restarting your node, you should be able to access the tendermint metrics (default port is 26660): http://localhost:26660
Make sure the following ports are open:
Install cosmos-exporter
wget https://github.com/solarlabsteam/cosmos-exporter/releases/download/v0.3.0/cosmos-exporter_0.3.0_Linux_x86_64.tar.gz
tar xvfz cosmos-exporter*
sudo cp ./cosmos-exporter /usr/bin
rm cosmos-exporter* -rf
sudo useradd -rs /bin/false cosmos_exporter
BOND_DENOM=aISLM
BENCH_PREFIX=haqq
RPC_PORT=26657
GRPC_PORT=9090
Then we need to create a systemd service for our app:
sudo tee <<EOF >/dev/null /etc/systemd/system/cosmos-exporter.service
[Unit]
Description=Cosmos Exporter
After=network-online.target

[Service]
User=cosmos_exporter
Group=cosmos_exporter
TimeoutStartSec=0
CPUWeight=95
IOWeight=95
ExecStart=cosmos-exporter --denom ${BOND_DENOM} --denom-coefficient 1000000 --bech-prefix ${BENCH_PREFIX} --tendermint-rpc http://localhost:${RPC_PORT} --node localhost:${GRPC_PORT}
Restart=always
RestartSec=2
LimitNOFILE=800000
KillSignal=SIGTERM

[Install]
WantedBy=multi-user.target
EOF
Then we'll add this service to the autostart and run it:
sudo systemctl enable cosmos-exporter
sudo systemctl start cosmos-exporter
sudo systemctl status cosmos-exporter # validate it's running
Install node-exporter
wget https://github.com/prometheus/node_exporter/releases/download/v1.3.1/node_exporter-1.3.1.linux-amd64.tar.gz
tar xvfz node_exporter-*.*-amd64.tar.gz
sudo mv node_exporter-*.*-amd64/node_exporter /usr/local/bin/
rm node_exporter-* -rf
sudo useradd -rs /bin/false node_exporter
Then we need to create a systemd service for our app:
sudo tee <<EOF >/dev/null /etc/systemd/system/node_exporter.service
[Unit]
Description=Node Exporter
After=network.target

[Service]
User=node_exporter
Group=node_exporter
Type=simple
ExecStart=/usr/local/bin/node_exporter

[Install]
WantedBy=multi-user.target
EOF

sudo systemctl daemon-reload
sudo systemctl enable cosmos-exporter
sudo systemctl start cosmos-exporter
sudo systemctl enable node_exporter
sudo systemctl start node_exporter
Monitoring Server
Prometheus
Download the latest version of Prometheus with the WGET command:
mkdir -p /tmp/prometheus
cd /tmp/prometheus
curl -s https://api.github.com/repos/prometheus/prometheus/releases/latest | grep browser_download_url | grep linux-amd64 | cut -d '"' -f 4 | wget -qi -
tar xvf prometheus*.tar.gz -C . --strip-components=1
Afterwards, we move the Prometheus and Promtool files from the Prometheus folder to /usr/local/bin
cd /tmp/prometheus
mv prometheus promtool /usr/local/bin/
sudo mkdir /etc/prometheus
mv prometheus.yml /etc/prometheus/prometheus.yml
mv consoles/ console_libraries/ /etc/prometheus/
Change default /etc/prometheus/prometheus.yml to
# my global config
global:
  scrape_interval: 15s # Set the scrape interval to every 15 seconds. Default is every 1 minute.
  evaluation_interval: 15s # Evaluate rules every 15 seconds. The default is every 1 minute.

# Alertmanager configuration
alerting:
  alertmanagers:
    - static_configs:
        - targets:
          # - alertmanager:9093

rule_files:
  # - "first_rules.yml"
  # - "second_rules.yml"

scrape_configs:
  - job_name: prometheus
    metrics_path: /metrics
    static_configs:
      - targets: [localhost:9090]
  - job_name: cosmos
    metrics_path: /metrics
    static_configs: []
  - job_name: node
    metrics_path: /metrics
    static_configs: []
  - job_name: validators
    metrics_path: /metrics/validators
    static_configs: []
  - job_name: validator
    metrics_path: /metrics/validator
    relabel_configs:
      - source_labels: [address]
        target_label: __param_address
    static_configs: []
  - job_name: wallet
    metrics_path: /metrics/wallet
    relabel_configs:
    - source_labels: [address]
      target_label: __param_address
    static_configs: []
Create a Prometheus user, required directories, and make Prometheus the user as the owner of those directories
sudo useradd --no-create-home --shell /bin/false prometheus
sudo mkdir /var/lib/prometheus
sudo chown -R prometheus:prometheus /etc/prometheus
sudo chown -R prometheus:prometheus /var/lib/prometheus
sudo chown prometheus:prometheus /usr/local/bin/prometheus
sudo chown prometheus:prometheus /usr/local/bin/promtool
Let's set up Prometheus. For the sake of simplicity, we create the files for the systemd service:
sudo tee /etc/systemd/system/prometheus.service<<EOF
[Unit]
Description=Prometheus
Documentation=https://prometheus.io/docs/introduction/overview/
Wants=network-online.target
After=network-online.target
[Service]
Type=simple
User=prometheus
Group=prometheus
ExecReload=/bin/kill -HUP \$MAINPID
ExecStart=/usr/local/bin/prometheus \
  --config.file=/etc/prometheus/prometheus.yml \
  --storage.tsdb.path=/var/lib/prometheus \
  --web.console.templates=/etc/prometheus/consoles \
  --web.console.libraries=/etc/prometheus/console_libraries \
  --web.listen-address=0.0.0.0:9090 \
  --web.external-url=
SyslogIdentifier=prometheus
Restart=always
[Install]
WantedBy=multi-user.target
EOF
Configure prometheus to listen to validator metrics
sudo apt install jq -y
sudo apt install python3-pip -y
sudo pip install yq
Create script add_validator.sh with content:
yq -i -y '.scrape_configs[] |= (.job_name as $name | .static_configs += if $name == "prometheus" then [] else ([{targets:["'$1'" + (if $name == "node" then ":9100" elif $name == "cosmos" then ":'$2'" else ":9300" end)], labels:(if $name == "validator" then {address: "'$3'"} elif $name == "wallet" then {address: "'$4'"} elif $name == "node" then {instance: "'$5'"} else {} end)}]) end)' /etc/prometheus/prometheus.yml
Give rights for script execution:
chmod +x add_validator.sh
Run created script with our validator data:
./add_validator.sh VALIDATOR_IP PROM_PORT VALOPER_ADDRESS WALLET_ADDRESS PROJECT_NAME
./add_validator.sh 1.2.3.4 26660 haqqvaloper1ul80t0j9kg5qjum9at7tpuu7w9eu3rd0x7hwxy haqq1ul80t0j9kg5qjum9at7tpuu7w9eu3rd02umqz9 cosmos
Reload the systemd service to register the prometheus service and start the prometheus service.
sudo systemctl daemon-reload
sudo systemctl start prometheus
Grafana
Grafana is an open source interactive data-visualization platform, developed by Grafana Labs, which allows users to see their data via charts and graphs that are unified into one dashboard (or multiple dashboards!) for easier interpretation and understanding.
The official installation guide can be found here.
sudo apt-get install -y apt-transport-https
sudo apt-get install -y software-properties-common wget
sudo wget -q -O /usr/share/keyrings/grafana.key https://packages.grafana.com/gpg.key
echo "deb [signed-by=/usr/share/keyrings/grafana.key] https://packages.grafana.com/enterprise/deb stable main" | sudo tee -a /etc/apt/sources.list.d/grafana.list
sudo apt-get update
sudo apt-get install grafana-enterprise
Now you need to start the grafana server with systemd.
sudo systemctl daemon-reload
sudo systemctl start grafana-server
Configure the Grafana server to start at boot.
sudo systemctl enable grafana-server.service
Now let's configure the Grafana interface. Open in browser http://<YOUR-HOST-IP>:3000

Your username is admin and your password is admin. If you don’t see the screen below, then your firewall is probably not open on port 3000 or you made a mistake somewhere in the previous steps.
Go back to the Grafana page and then click on Configuration and then Data Sources

Now click on Add data source, then select the Prometheus data source.

Now enter the IP address with port 9090. If you decided to run Prometheus and Grafana on the same server, that’s fine. Go ahead with http://localhost:9090

Scroll to the bottom and click the Save & test button. Now hover on Dashboards and then click Import

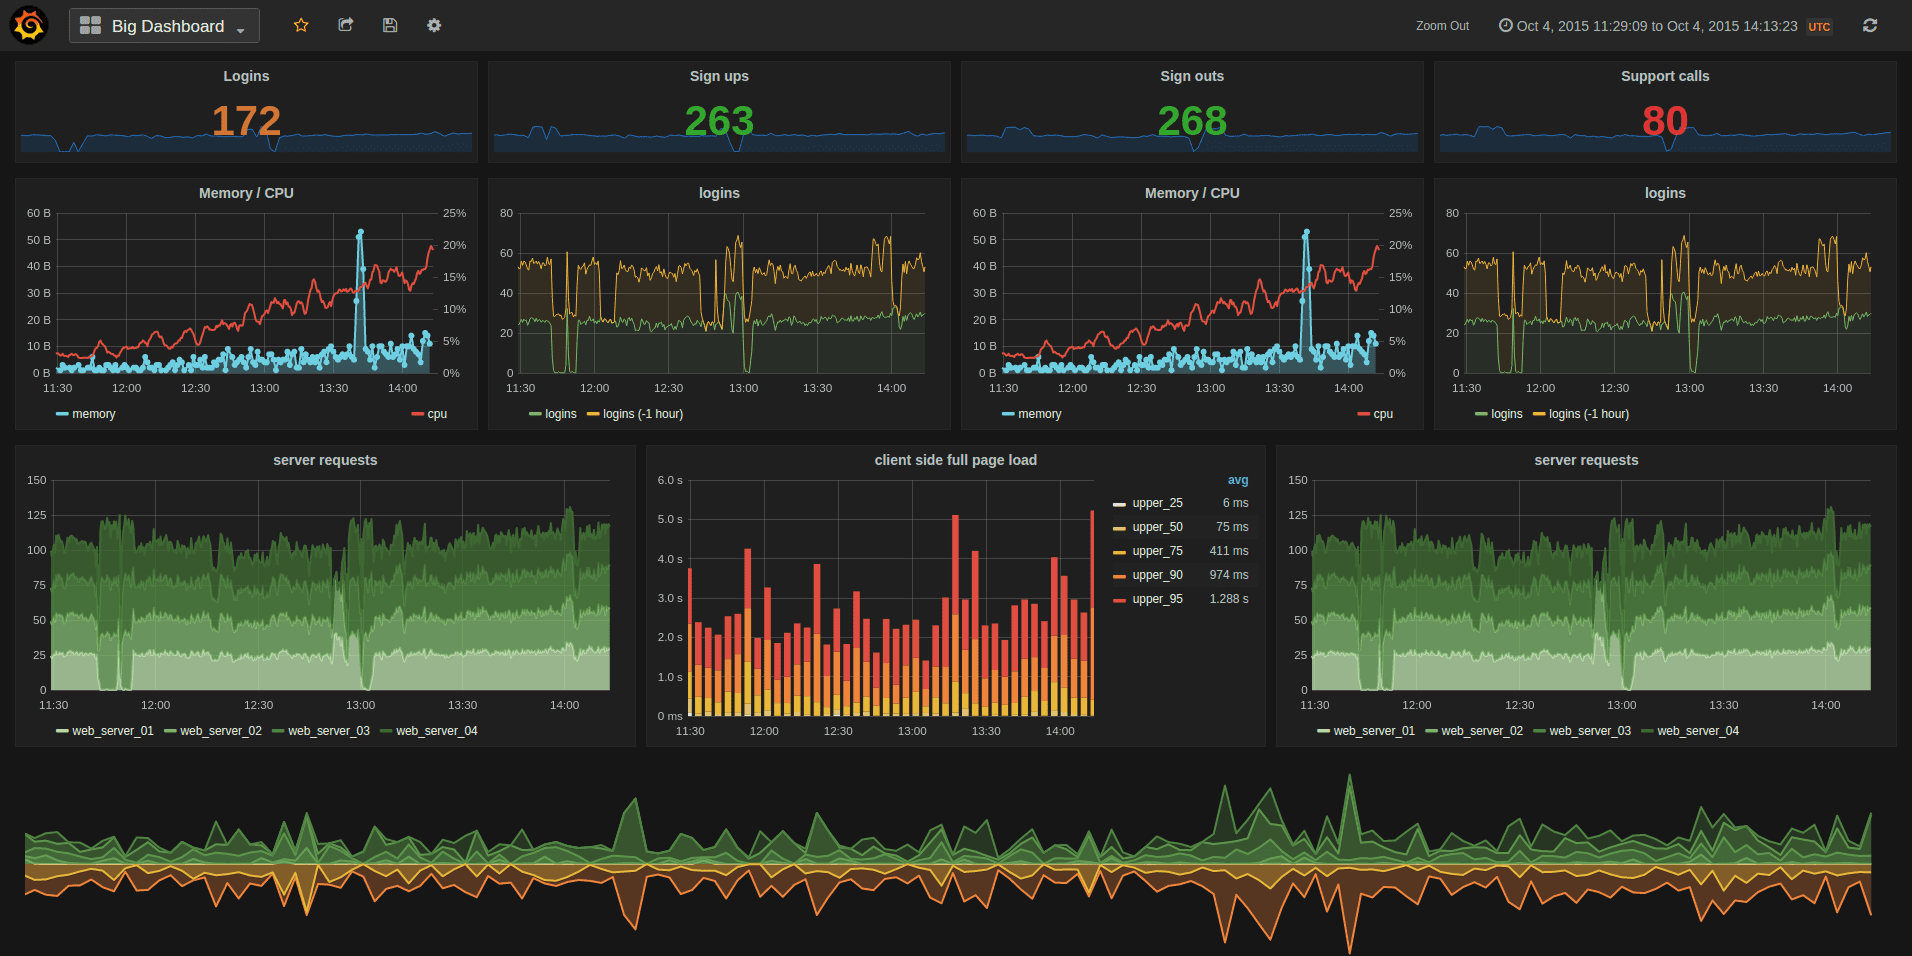
Import dashboard by ID 15991. Now you can see a dashboard with a lot of useful information.

At the top of the filters you can specify the network (if you centrally set up monitoring for multiple validators/chains)
