Monograph on Hypothesis Testing in Statistics
You may have heard of something in mathematics and specifically in statistics referred to as hypothesis testing or the testing of an hypothesis. Before we can discover what exactly is hypothesis testing and the significance of testing the hypothesis in statistics, we need to define terms which are related to this concept.
So, let's begin by defining what an hypothesis is. One classic definition of an hypothesis is that it is the process of using data from samples to test whether populations are the same or different. Another definition of an hypothesis in more simplistic terms is that it is a premise or claim that we want to test. One way of testing an hypothesis in statistics is not to go into a laboratory and run an experiment, but rather to generate a survey or a poll of 100, 200 or more people and gather data from this survey to study the general population of individuals based on the sample taken of that population and make inferences on the population based on a smaller sample of the population which is more feasible than surveying a much larger group. So, the hypothesis which we would like to test is an idea or a concept that we would like to discover is true or not. It could be as simple as whether all clouds contain dust particles or as complex as whether gravity is an actual force or whether it is the warping of space-time that yields the effect of a force in space.
In statistics, when we refer to the hypothesis, we are speaking about two distinct terms. The first term is what is referred to as the Null Hypothesis. This can be viewed as the default hypothesis or the accepted norm and is denoted by the symbol H0. Another definition of the Null Hypothesis is that it is the currently accepted value for a parameter. An example of this might be the mean IQ of students in High School, where the mean is the parameter that has a currently accepted value, say, 110. Now, if someone comes along and wishes to challenge the currently accepted value of the mean of the IQ attributed to High School students, then we say the hypothesis proposed by this individual is the Alternative Hypothesis, or HA to be tested. The Alternative Hypothesis is sometimes referred to as the Research Hypothesis in some literature as well and involves the claim to be tested. A prime example of this, going back to the gravity example, is that for centuries Sir Isaac Newton stated his theory on the way the Universe worked using his accepted theories of gravity and force to explain how the planets were held in orbits about the Sun and the moons surrounding those planets were held in their orbits about the planets and so forth. Then, along came Albert Einstein who said that Newton was right, but only up to a certain point. His claim (or Alternative Hypothesis) was that the forces described by Newton were true until we began to reach the speed of light at which point Newton's theories broke down and no longer accurately described how objects related to one another in space due to the effects of the massive bodies and the speed of light and its affect on something he referred to as space-time. As it turns out, Einstein was right and he proved Newton was not right about how gravity works in space-time and he accomplished this through experiments that he conducted to prove it.
So, to get a better understanding of the difference between H0 and HA (Null and Alternative Hypotheses, respectively), let's look at an example in the real world that describes this. Let's assume there is a machine that makes bed sheets with a thread count of 200 threads per inch. After this machine was recently overhauled it was claimed that the machine no longer made sheets with a thread count of 200, but instead now makes bed sheets with a thread count of 250 threads per inch. How would you write the Null Hypothesis and Alternative Hypothesis for the accepted value of thread count as opposed to the claimed difference in thread count which is being proposed by engineers after the machine has been overhauled? Well, the way we can think of this mathematically or statistically using symbols is as follows:
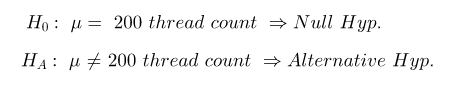
Thus, the Null Hypothesis and Alternative Hypothesis are mathematical opposites. So, in the example above, the accepted value of thread count for the bed sheet machine is 200 and the claim being made here is that the alternative value is NOT 200. This is the claim that must be tested. In essence, we are saying here that we are going to continue to accept H0 as being true unless through sampling HA shows the Null Hypothesis to be False, in which case we will reject the Null Hypothesis and promote HA to be the newly accepted norm. Let me be clear when I say that we're not necessarily stating that HA is true or that H0 is not true, what we are saying is that the evidence shows that H0 no longer appears to be acceptable.
What are the two outcomes of the test that is conducted through hypothesis testing? There are only two statistically distinct outcomes These are:
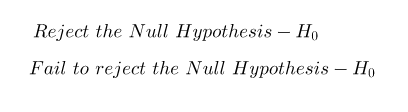
So, in statistics, we are not trying to prove whether H0 or HA are true, what we are doing is trying to reject the premise of the Null Hypothesis or fail to reject the premise of the Null Hypothesis which is similar to how a court of law works in which a person is presumed innocent and it is up to the prosecutor to reject or fail to reject a premise that would prove guilt or not. If we fail to reject H0, then we are saying that we believe the currently accepted value of H0 to be the case. On the other hand, if we reject H0, then we are saying that the data is pointing to the fact that H0 does not look promising any longer and we should accept the alternative, HA, as the new value to be trusted.
How do we test our Null Hypothesis to determine whether it should be rejected or that we fail to reject it? We use something in statistics called the Test Statistic. The test statistic is calculated from sample data and is used to decide whether we reject H0 or fail to reject H0 in the test. So, for example, let's say we take a sample of 50 bed sheets manufactured by the machine and we look at the data to obtain the average thread count of the sheets sampled. Additionally, we calculate the test statistic and use it to determine if there is any statistical significance in the data that would indicate whether we should reject or fail to reject the Null Hypothesis. In statistics, what exactly is statistical significance? Statistical significance is where we draw the line in order to make a decision as to whether to reject or fail to reject the Null Hypothesis. Working through the thought process on how this works, we can see that on Monday, engineer #1 takes 50 bed sheets at random from the machine and determines that the average thread count is 200.4. On Wednesday, another engineer #2 takes a sample of 50 bed sheets and determines the average thread count to be 204. And, finally, on Friday, the third engineer #3 samples 50 bed sheets and records the average thread count to be 220. This is itemized in the table below:
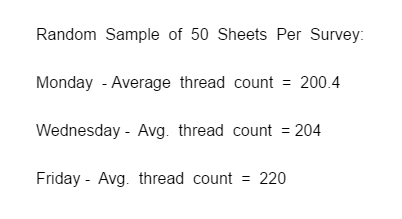
So, looking at the sample data, the sample taken on Monday doesn't look too bad. In fact, it would suggest that the Null Hypothesis is valid and that we should fail to reject it. However, the sample data gathered on Wednesday is not as good and it now becomes questionable whether the machine is functioning properly. But, the clincher appears to come when Friday's sample is taken where the average thread count appears to be statistically significant and that we have a problem with H0 and perhaps we should reject it. But, how do we know where the line is drawn when we should reject H0 or we should fail to reject H0? So, in my mind, the sample on Friday of 220 threads per count is a fairly clear indication that we have sampled enough bed sheets to show that the 220 value is statistically significant and that H0 should be rejected. However, based on Wednesday's sample, one might suggest that we should take a larger sample than 50, say 100, and look at that data before making a determination.
The test statistic is the means whereby we statistically determine whether the Null Hypothesis should be rejected or that we fail to reject it. We can't use subjectivity in making our decision, so we rely on the test statistic to remove the bias, if you will, in our decision making. The test statistic that can be used to set the boundaries for what is and is not acceptable is called the Level of Confidence, typically denoted by C. The value of C can be 95% or 99%, written as a decimal as 0.95 or 0.99. It is how confident we are in our decision regarding the data sampled from the population. We can think of C = 0.99 in terms of how certain we are that the Null Hypothesis should be rejected and replaced by the alternative or that we should fail to reject the Null Hypothesis and it should remain as the correct choice in our decision.
The complement of the Level of Confidence is the Level of Significance. This is typically denoted by the Greek letter alpha and written as a = 1 - C. So, if the Level of Confidence, C, is 95%, then C = 0.95 and, therefore, its complement a = 1 - 0.95 = 0.05.
In conclusion, statisticians do not have to prove that the Null Hypothesis is True, all that is required is to show that within a certain level of confidence (90%, 95% or 99%, etc.) the data sampled from the population of data indicates that there is a statistical significance when the statistical test is conducted to reject or to fail to reject the Null Hypothesis, which is the current acceptable norm.
Here is part 2 of this monograph on Hypothesis Testing in Statistics entitled: Writing Null and Alternative Hypotheses.