Writing Null and Alternative Hypotheses
Now that we have a better understanding of exactly what a Null Hypothesis is which is denoted by the symbol H0 in statistics and what the Alternative or Research Hypothesis is which is denoted by HA, let's look at a few examples that show us how to write these properly.
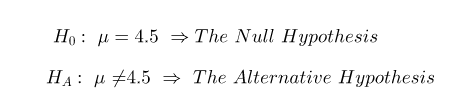
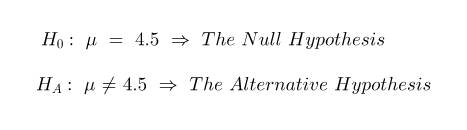
Recall from the previous blog article that I said that the Null and Alternative Hypotheses are mathematical opposites. Thus, if we have stated the Null Hypothesis is that the population mean is 4.5, then it follows that the Alternative Hypothesis would be that the population mean is NOT 4.5. This is written as follows:
So, let's look at a few actual real world problems that have Null and Alternative Hypotheses and see how we can write these out before we actually conduct our sample testing in a later blog article and reject or fail to reject the Null Hypothesis based on the result of our tests which we perform using the Test Statistic we talked about in my previous blog article.
Example 1: A soda straw manufacturing company says that it manufacturers soda straws with a 4 mm diameter. A worker in that company believes that straws are no longer being manufactured with this diameter and samples 100 straws to conduct a hypothesis test with a 99% confidence level. How do we write out the Null and the Alternative Hypothesis for this example?
The Null Hypothesis for Example 1 would be written as:
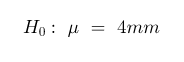
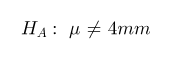
Here, we are stating that the Null Hypothesis is that the population mean diameter of straws manufactured by the company is 4 mm. The Alternative Hypothesis for Example 1, then, would be the mathematical opposite of this statement which would be written as:
The confidence level stated in this first example is 99%. This implies that the value of C which denotes confidence level in statistics would be 0.99. This is written as C = 0.99. Since C = 0.99, then it follows that the level of significance (alpha) denoted by a = 1 - C implies a = 0.01. So, here we have the following:
Confidence Level C = 0.99, and
Significance Level a = 0.01.
Remember, the confidence level, C, and significance level, a, always add to 1. In addition to this information from Example 1, we are told that the worker sampled 100 straws from the population and in statistics, the sample value is denoted by the letter n. Thus, in the problem, n = 100. Let's look at another example that is a little different from the example we just reviewed.
Example 2: Doctors in the United States believe that the average teenager sleeps no longer than 10 hours per day. A researcher believes that teens in America on average sleep longer. To test his hypothesis, the researcher conducts a random sample of 500 teens across the United States. He wishes to have a statistical level of significance of 0.05 in his assertion representing the Alternative Hypothesis. How would we write out the Null and Alternative Hypotheses for this example? What would be the confidence level for this test and what would be the value of n?
The Null Hypothesis is a statement about what the current belief is regarding the average amount of sleep being no more than 10 hours for the average teenager in the United States. This would be expressed mathematically as:
Here, we are saying that the current belief is that the population average sleep period among teens is no greater than 10 hours expressed as less than or equal to 10 hours. The Alternative Hypothesis, then that would follow is the mathematical opposite of the Null Hypothesis which would be written as:
Since the level of significance in this problem was given as 0.05, this implies that the confidence level for the test to be administered using this Test Statistic would necessarily be C = 1 - a = 1 - 0.05 = 0.95 or 95%. The value of n is the sample size for the test, which is given to us as 500, and so n = 500.
The final example I have chosen for this exercise is the following:
Example 3: The local school board claims that at least 60% of students bring a phone to school. A teacher believes this number to be too high and randomly samples 25 students to test with a level of significance of 0.02. How would you write H0 and HA in this example?
In this particular problem, we are not dealing with the mean of the population as we have in the previous two examples, but rather we are working with a percentage or proportion of students (60%) that it is said who bring phones to school. So, the Null hypothesis will not be using the population mean in its expression. Instead, we will use the proportion, P. Let's look at the Null Hypothesis for this example:
In this expression for the Null Hypothesis, we are asserting that it is believed that the proportion of students who bring phones to school is greater than or equal to 60% (written as a decimal equivalent) which means the same as at least 60% of students bring phones to school. If this is the Null Hypothesis, then how do we write the Alternative or Research Hypothesis for this example? Well, recall that I said that the Alternative Hypothesis is the mathematical opposite of the Null Hypothesis. This means that we would write the Alternative Hypothesis like this:
since the opposite of greater than or equal to some number is logically less than that same number. The significance level to be used in the test that would be conducted to either reject the Null Hypothesis or fail to reject the Null Hypothesis was stated to be 0.02. This implies that a = 0.02 and since the confidence level, C, is 1 - a, we get C = 0.98 or a 98% confidence level for the experiment. And, since the teacher is sampling randomly among 25 students, then n = 25 in this case.
Please join me in a future blog article where I will be showing you how to conduct the experiments we have talked about earlier and testing whether we should reject the Null Hypothesis or fail to reject the Null Hypothesis based on the data that we receive from the experiments themselves.
Part 3 of my Monograph on Hypothesis Testing in Statistics.